Jan 21, 2026
The response to our Insight Agent has been incredible! This surge in usage recently pushed our LLM providers to their limits, occasionally leading to resource constraint errors or timeouts.
We’ve been working around the clock to build a more resilient and contineously improving system for you. We are excited to announce a major infrastructure upgrade: advanced multi-region datacenter load balancing (that’s just fancy dev-speak for: "the Agent is now much harder to break, even when it’s busy" 🤓).
- What this means: The Insight Agent now intelligently routes requests to the most available datacenter, bypassing provider bottlenecks and ensuring stable performance even during peak hours.
- Performance: You'll notice significantly fewer errors and smoother analysis for large datasets.
- Compliance: Most importantly, our EU-only data residency remains unchanged. All data processing and storage continue to stay strictly within the European Union.
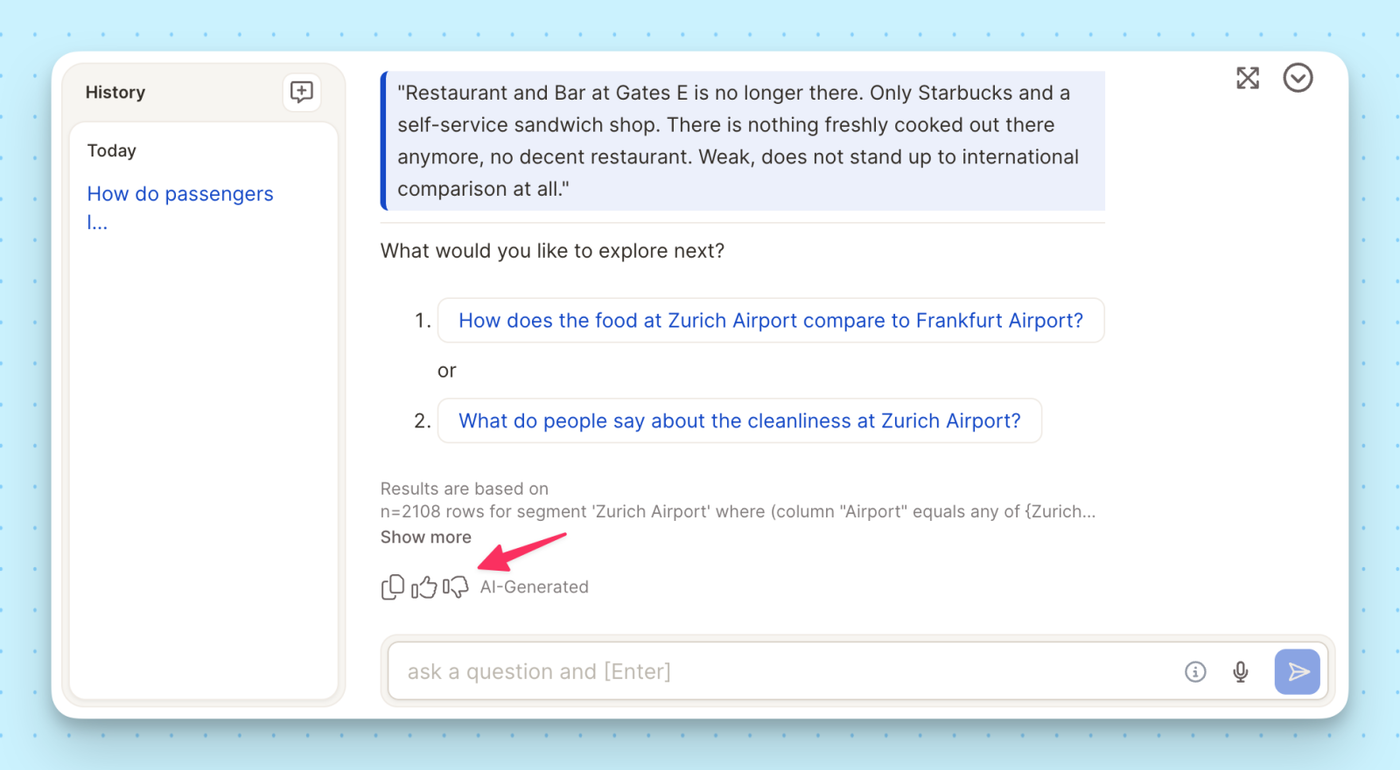
- Continuous Learning: A quick reminder that your Thumbs Up/Down ratings help the Agent refine its logic to better suit your specific tasks, project goals, and needs. We appreciate the feedback!