Data

Sep 19, 2025

Insights-Chat just got a serious upgrade. It no longer just answers questions — it now walks you through your data like a true analyst would.

Here’s what’s new:

1️⃣ Context first – Every answer starts with a solid basis: context, underlying data points, and why they matter.
2️⃣ Quantitative insights – See the numbers, metrics, and trends behind the story.
3️⃣ Qualitative insights – Understand what customers are actually saying, surfaced down to the verbatim level.
4️⃣ Visual support – Charts and graphics illustrate the findings, making complex points easy to digest.
5️⃣ Next-step guidance – Insights-Chat now even suggests what you should analyze next, helping you dig deeper without losing momentum.


🚀 The result: a conversation that feels less like querying a tool and more like collaborating with a data analyst.

Sep 16, 2025

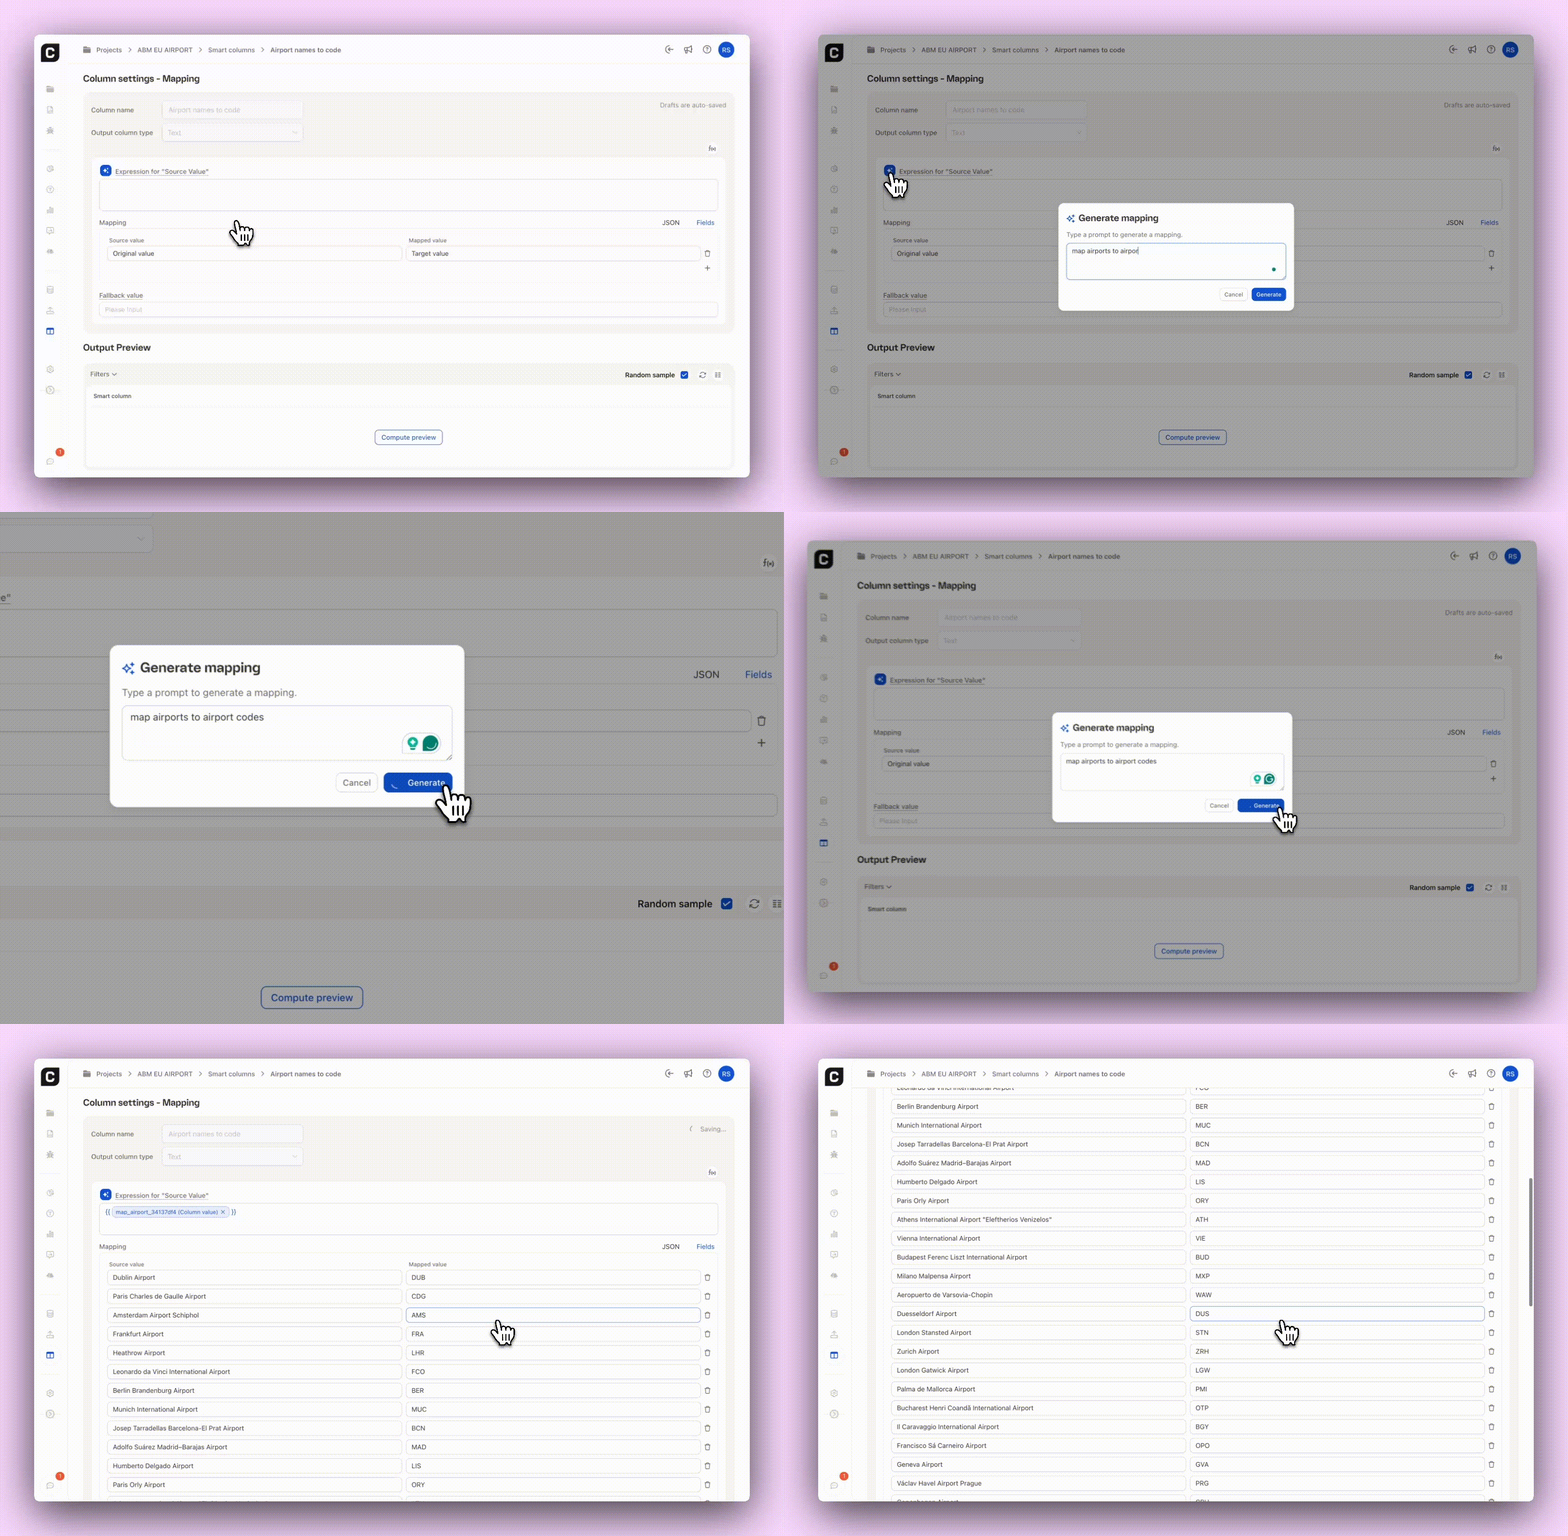
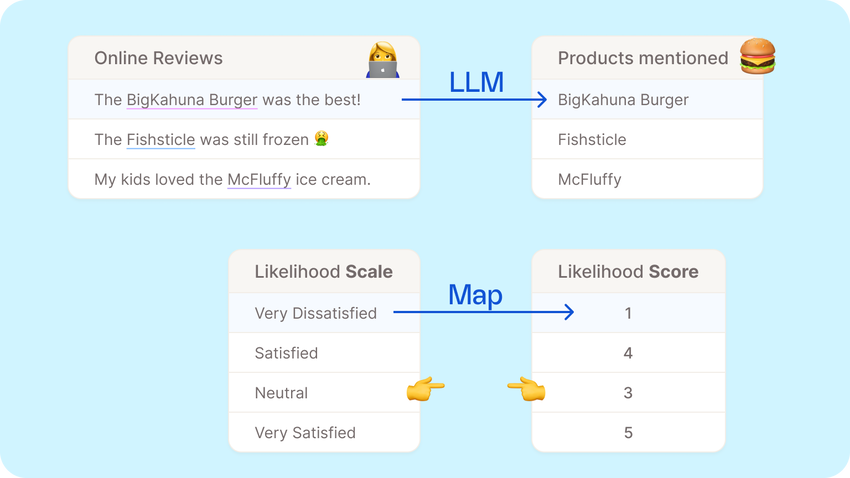
Valuable insights start with rich data. That’s why we built a powerful data enhancement feature — think Excel at scale, supercharged by LLMs. With Smart Columns, you can now:

🤖 Use LLMs to apply a prompt to each row (e.g.: Extract structured insights like product names or brands) from free-text feedback, fix spelling mistakes)
Map values from one column to another (e.g.: Transform scales to scores)
🧮 Run formulas across existing columns (e.g.: Merge likes & dislikes)

Your new columns update automatically whenever source data changes — no manual edits required.
Whether you're standardizing formats or using AI to tag content, Smart Columns do the heavy lifting.

🔍 Try it out via the “Smart Columns” section in your side bar navigation.

Sep 10, 2025

Our ecosystem just got bigger! You can now connect Caplena with:

  • Medallia – Voice of Customer insights
  • Alchemer – (formerly SurveyGizmo) survey feedback
  • Indeed – Candidate & employee experiences
  • Glassdoor – Employer brand perception

These integrations are currently in beta — meaning they’re fresh, functional, and still evolving. But you can already start pulling in open-ended feedback from these platforms directly into your Caplena projects.

Aug 13, 2025

You can now add new TTA (Text to Analyze) columns to existing projects.

This is great news if:

  • You’re expanding your analysis with additional verbatims
  • Your file structure evolves over time
  • You want to analyze separate inputs in the same project

🎯 No more prep work to align all TTA columns, sparse structures are now fully supported.

Jun 11, 2025

Good news — You can now append new data even if the TTA columns don’t match exactly.

Why this matters:

🛠️ Less Prep Work
No more manually deleting or filling in blank TTA columns just to get your file to upload. Caplena will handle it for you — saving time and frustration.

📂 More Flexibility
Uploading a slightly different file structure? No problem. You’ll no longer hit errors just because a column is missing or extra. We’ll keep things moving.

🚀 Faster Workflows
This small change means fewer interruptions and smoother data handling, especially for recurring or multi-source uploads.

So go ahead — upload with confidence, even if things aren’t 100% identical. We’ve got your back.

Apr 14, 2025

Ouch — found a couple of wrong entries in your data? No problem. Keeping your data clean and up-to-date is now easier than ever!

With our new Replace Rows feature, you can effortlessly update existing data from uploaded files — without messy workarounds or duplicate entries.

What’s new?

  • Quickly update existing data by replacing rows from your latest file via the Data section.
  • Keep IDs, structure, and context intact.
  • No more messy workarounds.

Perfect for tracking surveys, recurring feedback exports, or any evolving dataset. Just upload, replace, and stay in sync.

Apr 10, 2025

Managing your data just got a whole lot easier! Say hello to the brand-new Data Sources section — your central hub for everything related to data uploads and integrations in Caplena.

What’s new?

  • Clear Data Sources Overview — Instantly see how many sources power your project, how many rows you’ve got, and what source types you’re using.
  • Detailed Activity Log — Every file upload, API push, or integration sync is now automatically logged — making your data history fully transparent and traceable.
  • Integration Management Made Simple — Easily view, search, and filter all your connected data sources. Check status, last sync, and quickly spot issues like failed syncs or initialization errors.

Keeping track of your data has never been this organized. No more guessing where your data came from or what happened when — it’s all right here at your fingertips. 🚀

Mar 05, 2025

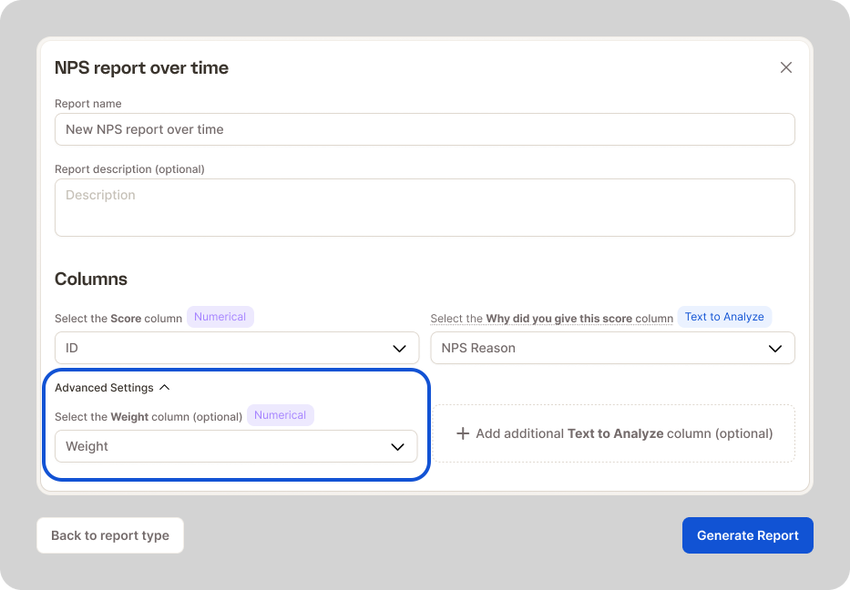
Tired of scrolling through endless dropdown menus? Now you can mark your favorite columns and have them appear right at the top for faster selection. No matter if within reports or an InsightChat conversation!

Simply head to the Data Table, pick your most-used columns, and ⭐ favorite them for effortless access.