We're giving you more room to experiment with Smart Column and Topic Assignment: more included runs, and cheaper overage on top. Here's what's new.
Smart Columns
Included LLM runs per row are doubling across the board:
Enterprise: 2 → 4
Team: 1 → 2
Agency: 2 → 4
And if you do go over, it's a lot cheaper now: overage pricingdrops from 0.25 to 0.1 credits per row, on every plan.
Topic Assignment
Same story here. Included runs go from 4 to 6 on Enterprise, Team, and Agency plans, and overage pricing falls from 0.5 to 0.2 credits per row across all plans.
Nothing to do on your end — these upgrades are already live on your account, and they apply to existing projects and Smart Columns too, not just new ones.
Semi-Open mode just got significantly better for large tracking studies like brand trackers.
What's new:
Import keywords directly — You can now import a keyword list into Semi-Open projects, making it much faster to set up and maintain large, structured topic collections.
Increased stability — We've improved how Semi-Open handles large volumes of short-text data, reducing inconsistencies in clustering results.
More configuration options in settings — New controls give you finer-grained tuning over how the algorithm groups and assigns topics, so you can match it to your specific data structure.
You can now filter any column by blank — empty cells are no longer invisible to your filters.
Whether you're tracking down a missing date, a smart column that didn't populate, or a row with an identifier error, just select the "blank" filter and they'll surface instantly. No more hunting through your data manually.
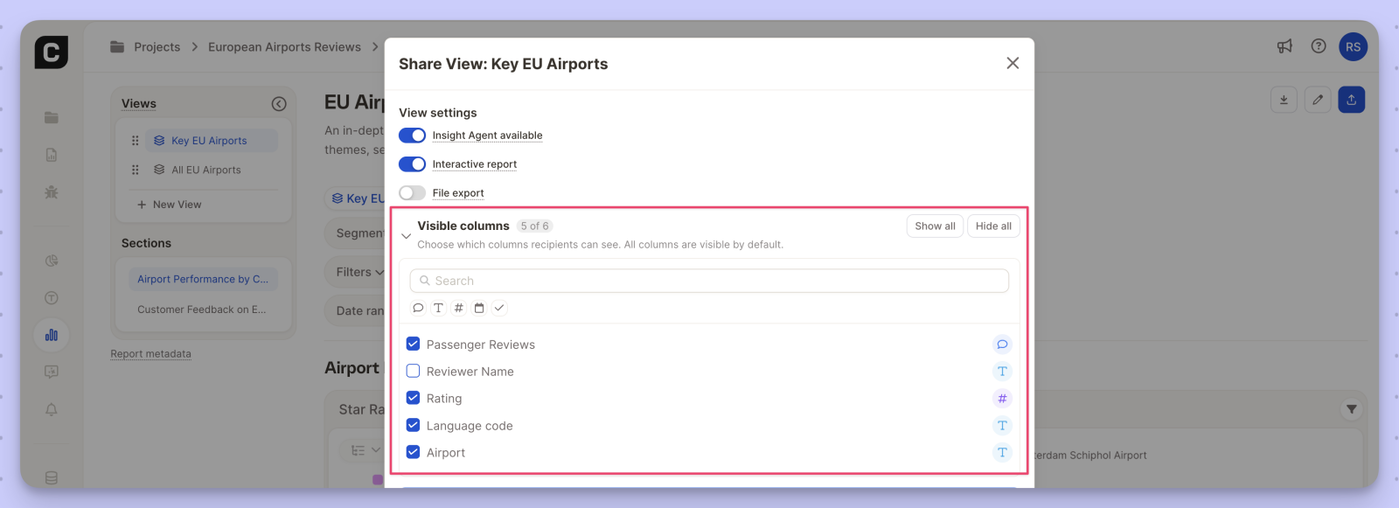
You can now control exactly which columns report viewers see when you share a view.
What's new
New Visible columns section in the view sharing settings
Check or uncheck individual columns per view
Hidden columns are excluded from the row browser, filters, segments, and insight elements
All columns visible by default — use Show all / Hide all to reset quickly
Search to find specific columns in larger datasets
Why it matters
Share cleaner, more focused views with external stakeholders or specific teams — without exposing raw data columns that aren't relevant to them.
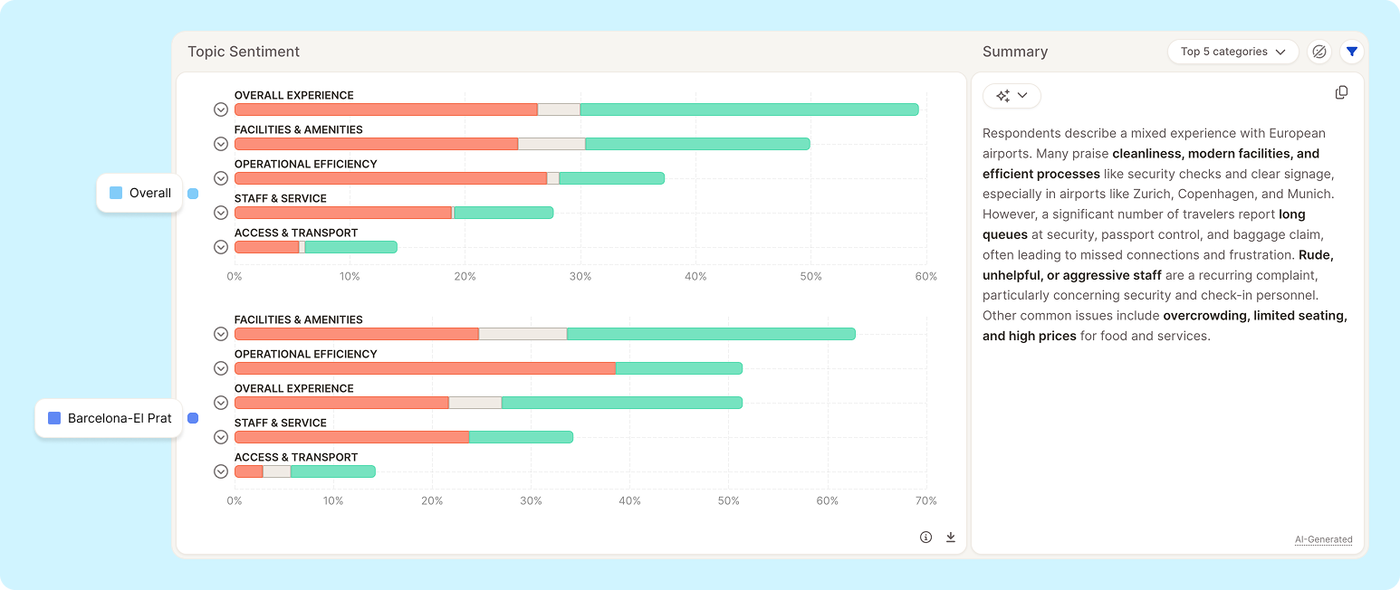
The Topic Sentiment insight element now supports comparing multiple segments side by side in a single view.
Previously, analyzing sentiment across segments required switching the segment filter back and forth. Now, when multiple segments are selected, the chart displays all of them at once, stacked by segment, so you can immediately see how sentiment on each topic varies across your audience.
What's new:
Select multiple segments and see all of them rendered in the Topic Sentiment chart simultaneously
Compare positive/negative sentiment per topic across segments without toggling filters
We've completely reworked how you create and manage segments in Caplena — making it faster, more flexible, and a lot more powerful.
Create Segments Your Way
The new Segment Editor gives you two ways to get started: manually or via AI prompt.
If you know exactly what you're looking for, the Manual path lets you build segments by combining filters — topics, categories, sentiment, rating, date range, and more. You get precise control over exactly which responses land in each segment.
Prefer to move faster? Use the new Create Through Prompt option: just describe what you're looking for in plain language, and Caplena will generate the segment for you. Great for exploring your data or quickly setting up common groupings without having to configure each filter by hand.
Create Multiple Segments at Once
One of the most requested improvements: you can now create multiple segments in a single flow, rather than going back and forth through the editor one by one. Select the values you want to work with and create segments from them in bulk — a big time-saver when you're setting up a new project or reorganizing an existing one.
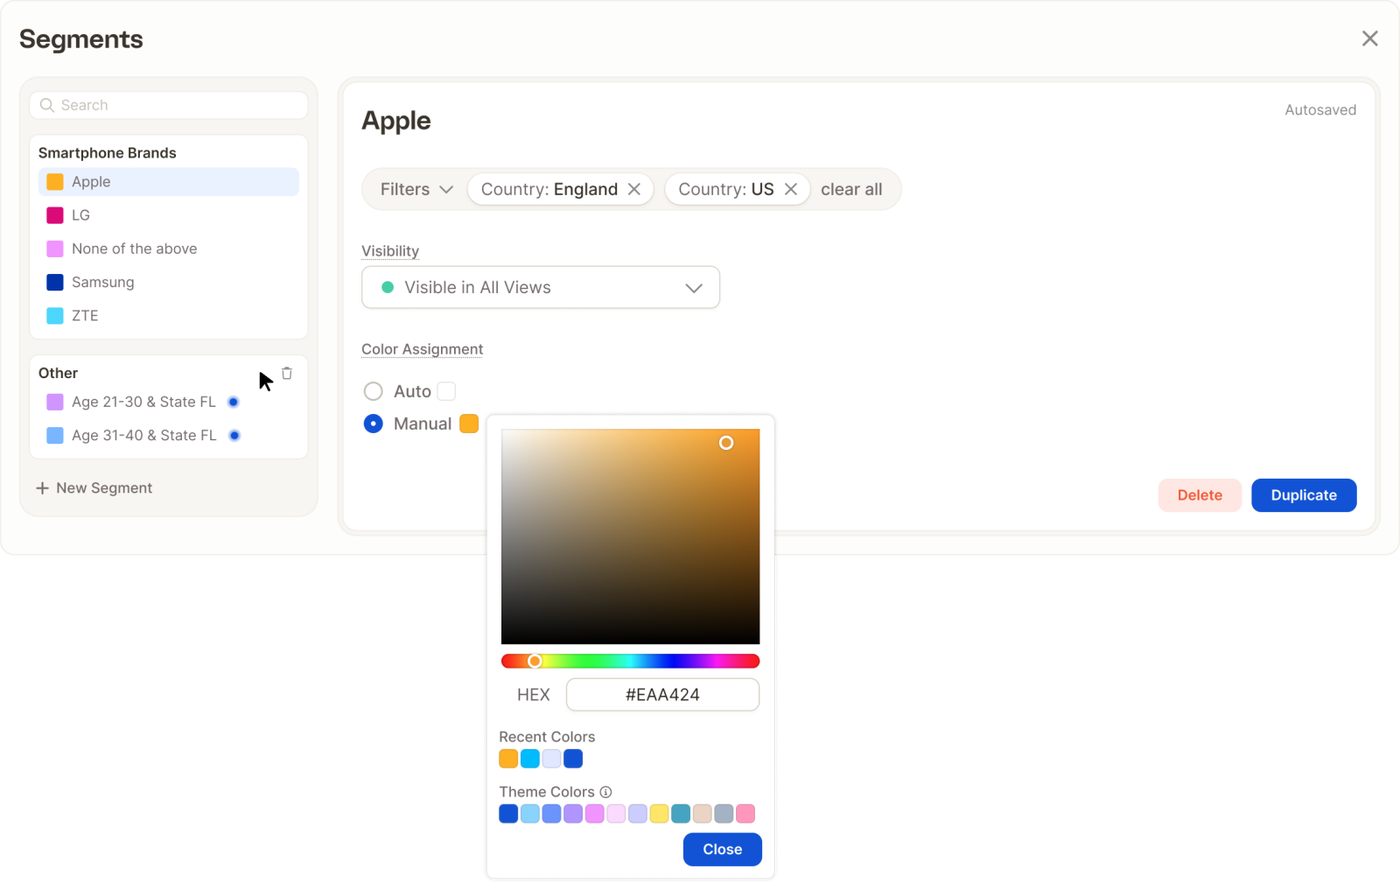
Full Control Over Segment Appearance & Visibility
Once a segment exists, editing it is straightforward. You can update the name, adjust the filters, and pick a custom color from a full color picker (in manual- or in auto-assign mode) — so your segments are easy to tell apart at a glance in charts and tables.
You can also control visibility: choose which segments are shown or hidden in your views, keeping things clean when you're working with a large number of groups.
The updated Segment Editor is available now across all projects via Edit Master. Give it a try and let us know what you think.
We've optimized rendering for table-based insight elements — especially when displaying a large number of topics. If you've been using the "All topics" selection in your reports, you should notice significantly faster load times and smoother interactions.
We’ve separated the global Report Master from your custom Views for a cleaner, more intuitive workflow. Plus, sharing just got a major upgrade. Let's dive in:
🧱 Edit Report Master: Think of it as your global foundation: Manage insight elements & sections per drag & drop, create segments and apply filters. The settings will automatically cascade down to all of your Views.
🔎 Configure Views: Select segments, apply filters, and lock them exactly as you are used to. Keep the Views sidebar perfectly organized by easily dragging & dropping your Views into any order.
🚀 Share: You can now instantly share a single View, a custom selection of Views, or the entire Report.
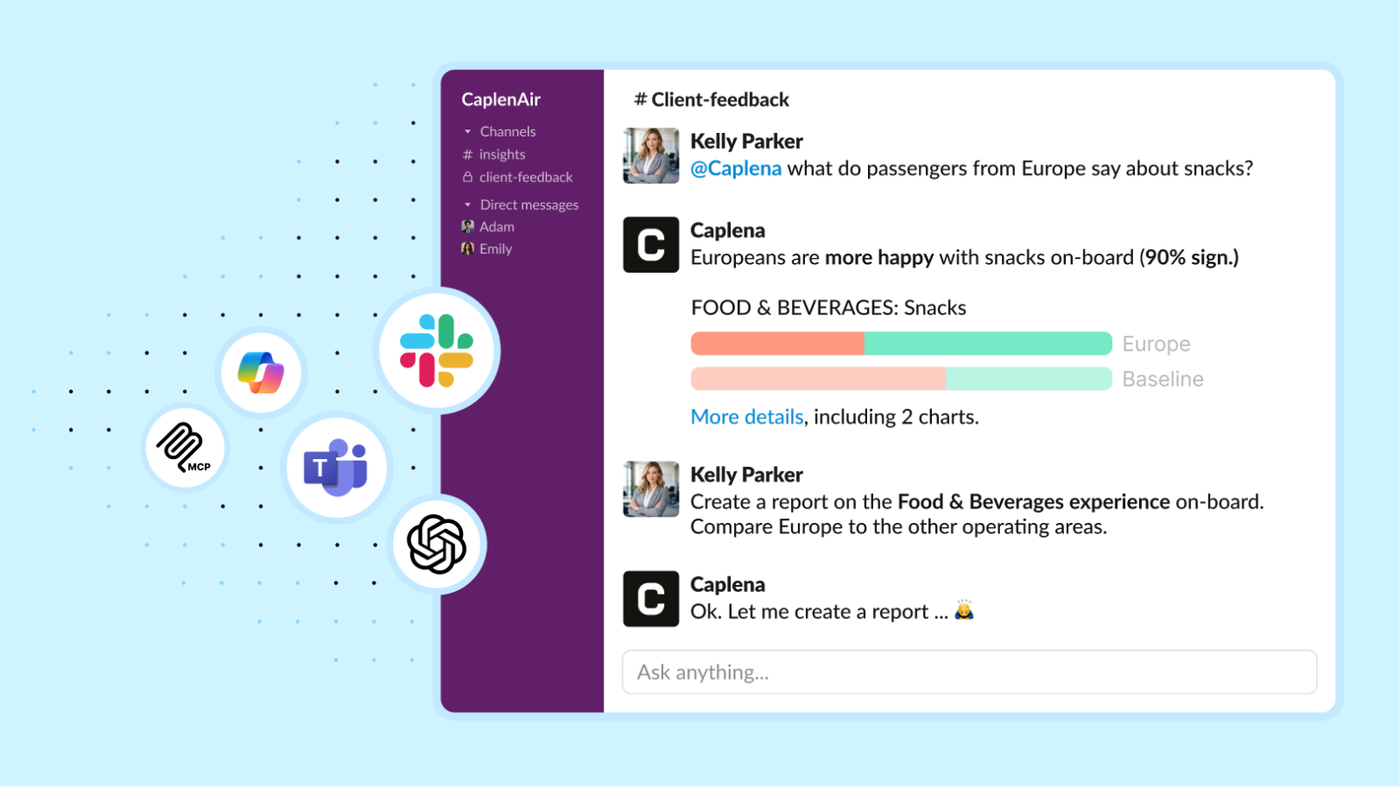
Powerful for Experts, Effortless for Everyone — now where work happens. Insight Agent is now available in Slack, Microsoft Teams, Copilot, and ChatGPT (MCP), so anyone can ask questions and get reliable insights without leaving their daily tools.
This is a big step toward democratizing insights across your organization: experts move faster with on-demand analysis, while non-research teams self-serve clear, actionable answers — no dashboards, training, or back-and-forth required. Less chasing data. More turning feedback into decisions. 💪
How it works
Create a shared channel (e.g., #customer-feedback-insights)
Ask questions by tagging the agent with @Caplena in 1:1 messages or public channels
Here is an example question: @Caplena What topics had the biggest impact on the NPS change in the last 4 weeks?
Advantages
Help teams discover what the bot can do (and copy great prompts)
Learn from each other’s use cases over time
Discuss insights together — and jump in if you disagree
Keep decisions and learnings accessible for everyone
👉 Set up the integration in your Integrations Settings and get started.
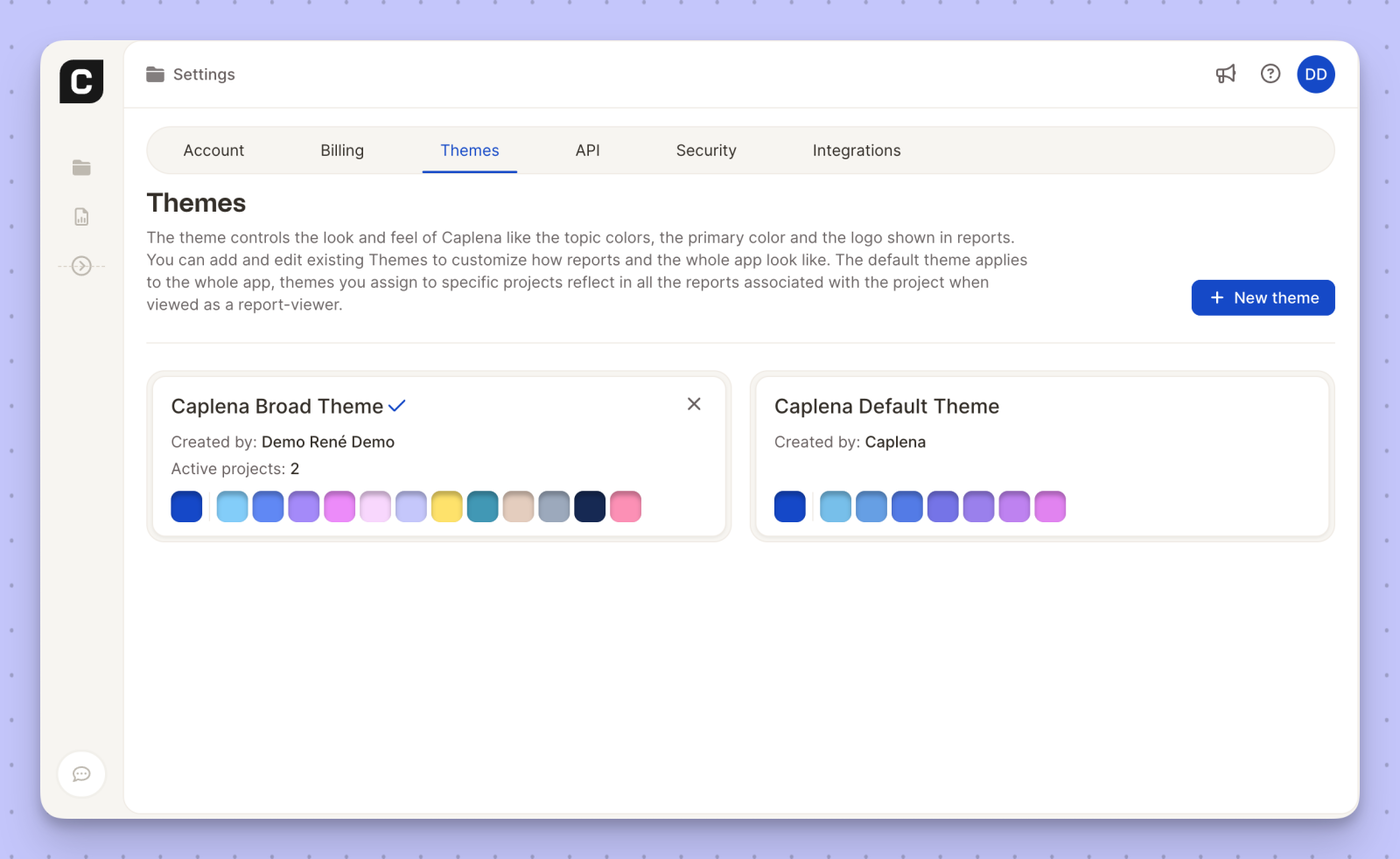
We’ve added a brand-new Caplena Broad Color Theme to give your reports more visual flexibility and a richer color palette.
The new theme expands the range of topic and chart colors, making it easier to:
Clearly distinguish categories and segments
Create more expressive, client-ready reports
Maintain visual clarity even in complex analyses
You can manage and assign the Caplena Broad Color Theme from Settings → Themes, just like any other theme. Once applied to a project, it will automatically reflect across all associated reports for report viewers.