Jan 12, 2026

We’ve heard your feedback: analyzing a deep-dive customer review requires a different "brain" than analyzing a list of 500 slightly misspelled brand names. To give you the best of both worlds, we are introducing Semi-Open Mode, a specialized algorithm designed for precision in short-text and brand-awareness data.
🧠 Choosing the Right Tool for the Task
Not all text data is created equal. Depending on your source—whether it's an open-ended "Tell us more" or an unaided brand recall question—you now have the power to choose the AI logic that fits best.
1. Open Mode: Deep Semantic Understanding
- Best for: Complex feedback, full sentences, and emotional nuances.
- How it works: This mode looks at the meaning behind the words. It understands negations ("not happy"), synonyms, and the underlying sentiment of multiple sentences.
- Use case: "The check-in was slow, but the staff was incredibly friendly and made up for it."
2. Semi-Open Mode: Precision for Short Text
- Best for: Unaided brand awareness, single words, or short word groups with many duplicates.
- How it works: This mode focuses on spelling similarity and clustering. It is optimized to catch typos and group variations of the same brand or product name without over-analyzing for "emotion."
- Use case: "Nike," "Niky," "Nike Inc," or "Adidas."
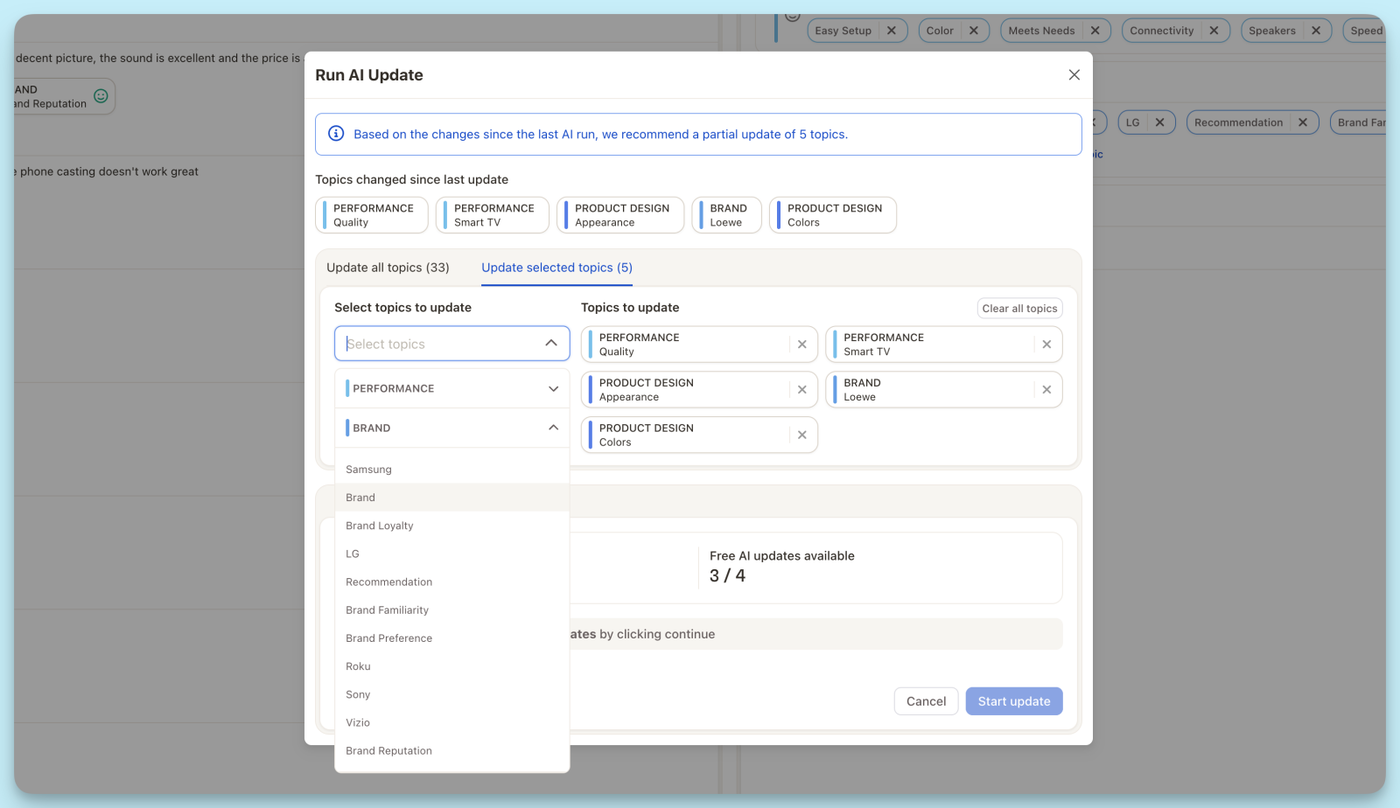
🛠️ How it Works in Your Workflow
We’ve integrated this choice directly into the Topic Assistant setup. In many cases, Caplena will even auto-detect if your data looks like a brand list and suggest the Semi-Open algorithm to save you time.