At Caplena, our goal has always been to turn the "noise" of open-ended text into clear, actionable insights. To keep pushing the boundaries of what AI can do for your feedback analysis, we are focusing all our energy on Caplena v3.
As part of this transition, we will be officially switching off the Caplena Legacy App on March 31, 2026. To ensure your workflows remain uninterrupted and to take advantage of our most powerful features yet, we encourage all users to start using v3 over the coming weeks.
Why the Move?
Caplena v3 isn't just a fresh coat of paint; it’s a completely re-engineered core designed for the era of Large Language Models (LLMs). Here is what you get in the new platform:
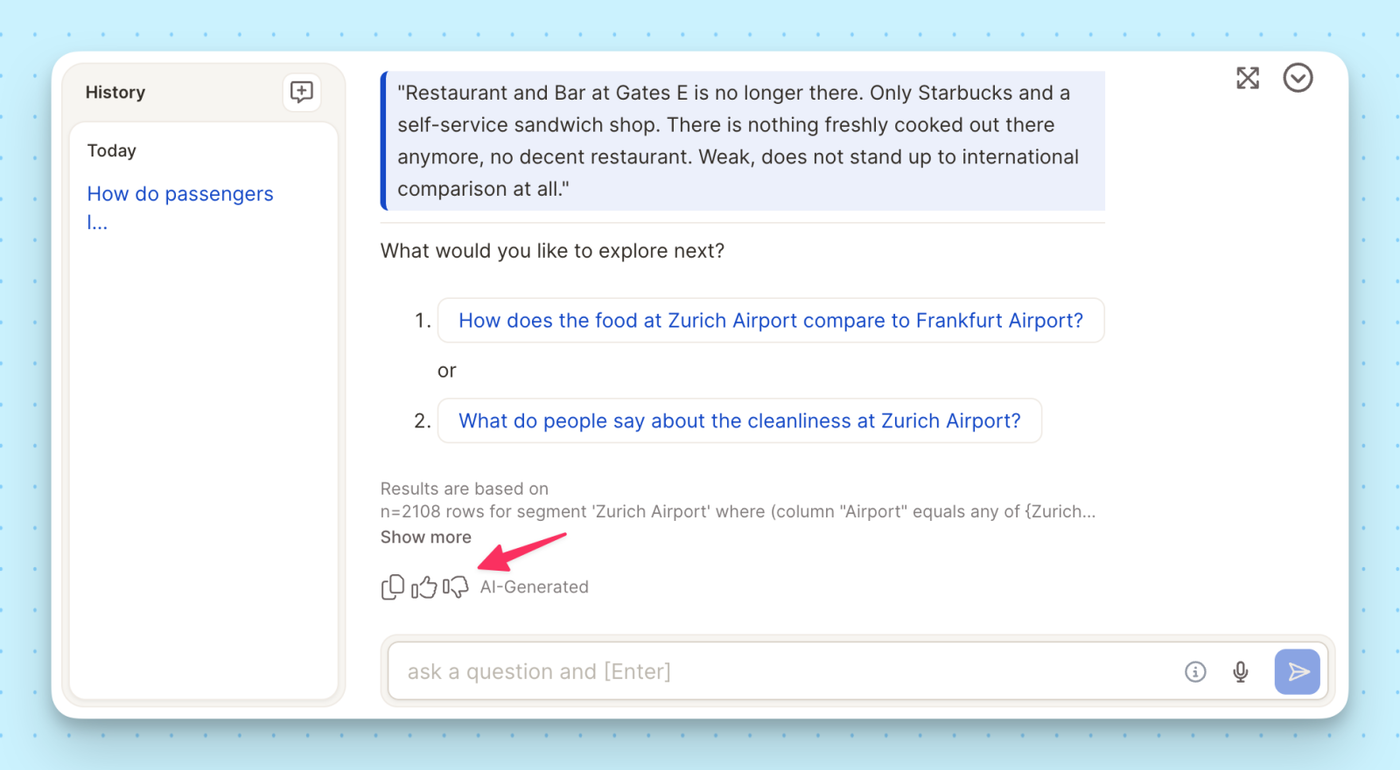
- Integrated LLM Power: Out-of-the-box human-level coding quality and your personal AI agent to explain the "why" behind your data.
- Smart Columns: A powerful new way to categorize and map data using custom logic and AI, giving you more flexibility than ever before.
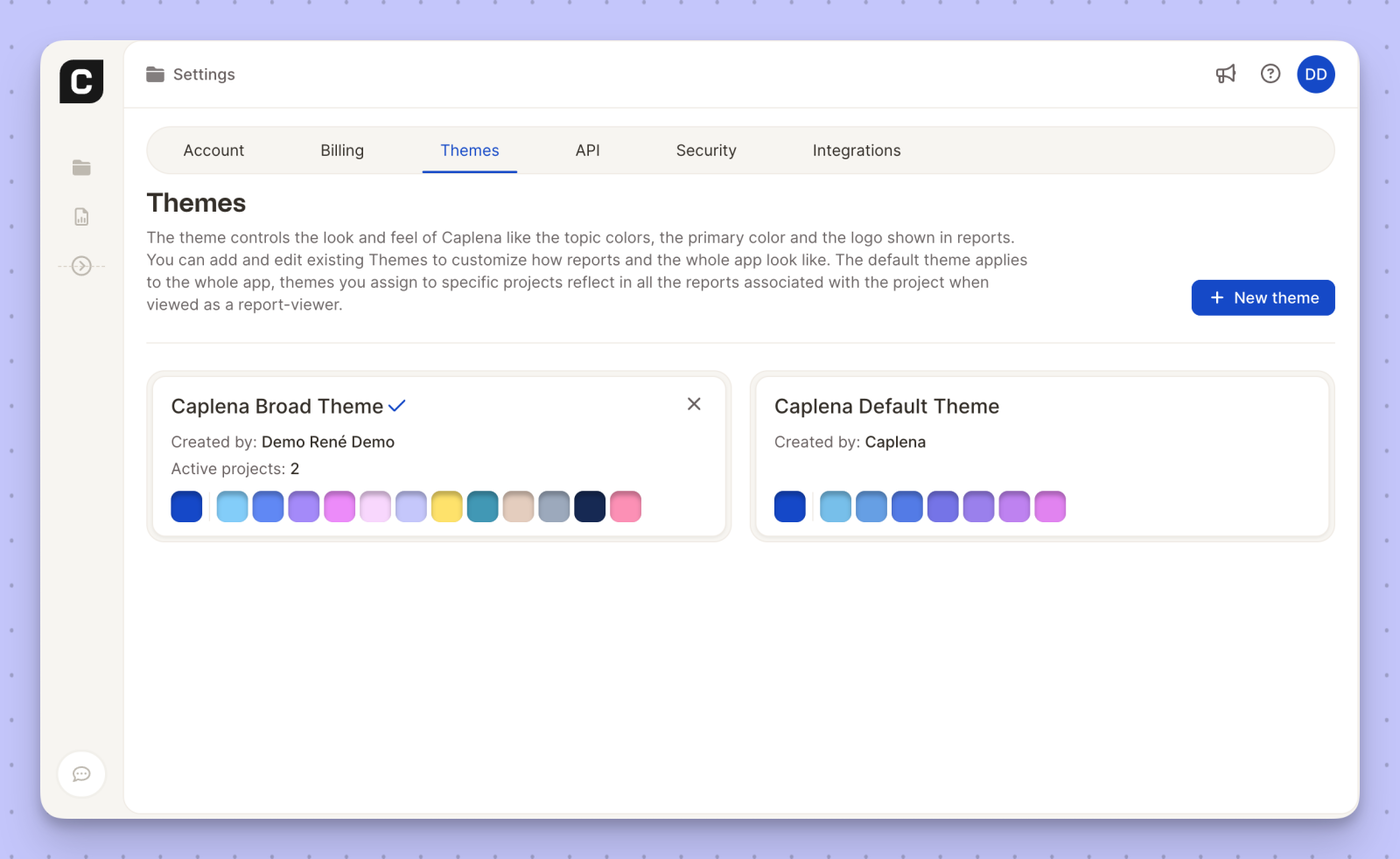
- Advanced Reporting & Views: Create multiple views with unique sets of filters and segments—one for each stakeholder, region, or product team.
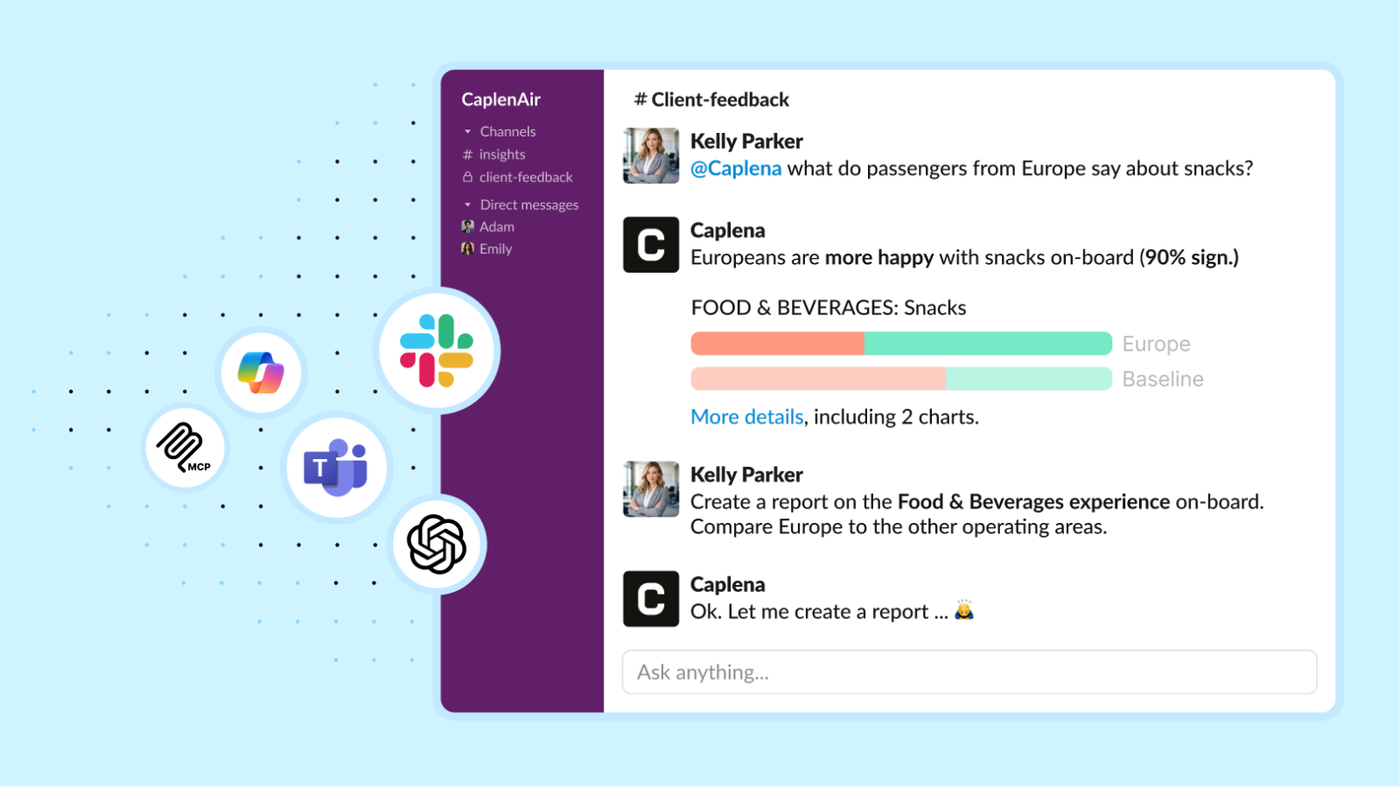
- Workflow Integrations: Connect seamlessly with Qualtrics, Medallia, Slack, Microsoft Teams, and 20+ other integrations.
- And much more! 🚀
How to Transition
All your projects are already in Caplena v3—no migration needed, and your historical data and custom codebooks are fully preserved. Just follow the steps below:
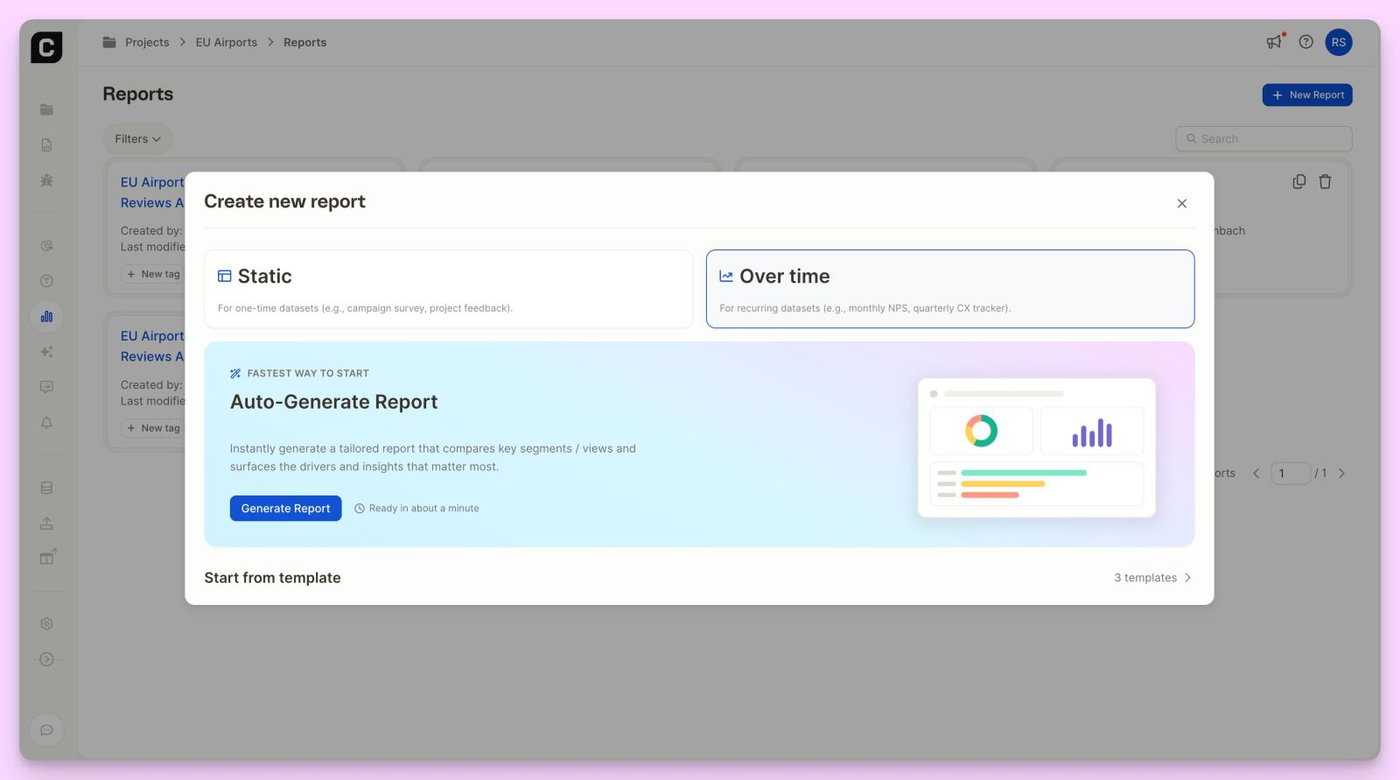
- Go to the Caplena v3 project home
- Choose your project(s)
- Create new reports with one click to visualize results and ask questions using the Insights Agent.
Need a hand with the move? Our support team is standing by to help with your migration.