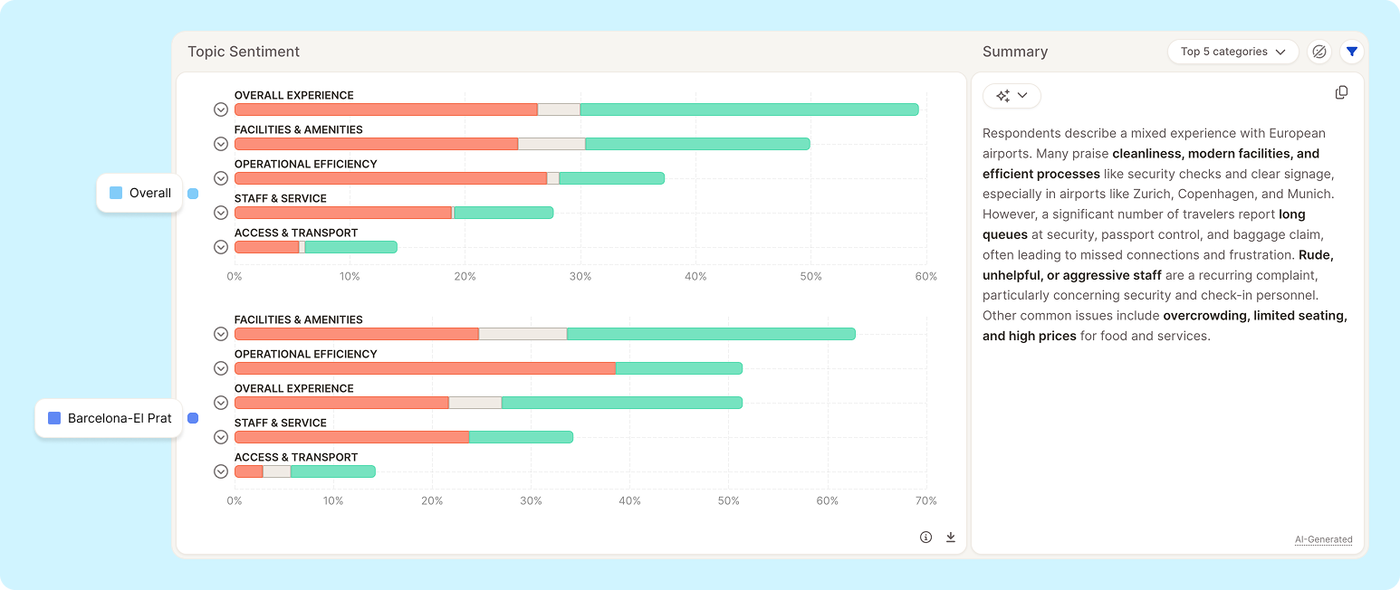
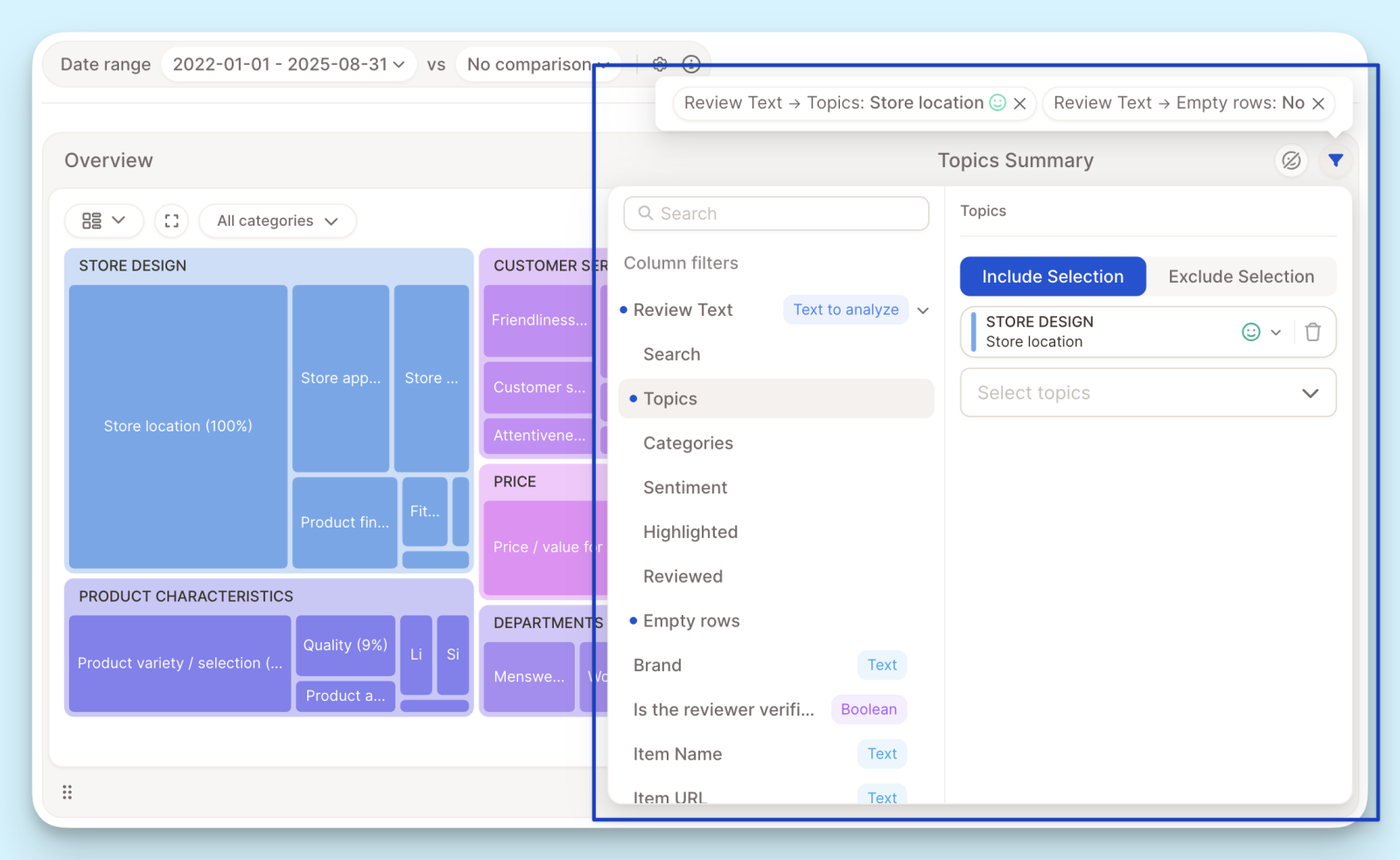
The Topic Sentiment insight element now supports comparing multiple segments side by side in a single view.
Previously, analyzing sentiment across segments required switching the segment filter back and forth. Now, when multiple segments are selected, the chart displays all of them at once, stacked by segment, so you can immediately see how sentiment on each topic varies across your audience.
What's new:
Select multiple segments and see all of them rendered in the Topic Sentiment chart simultaneously
Compare positive/negative sentiment per topic across segments without toggling filters
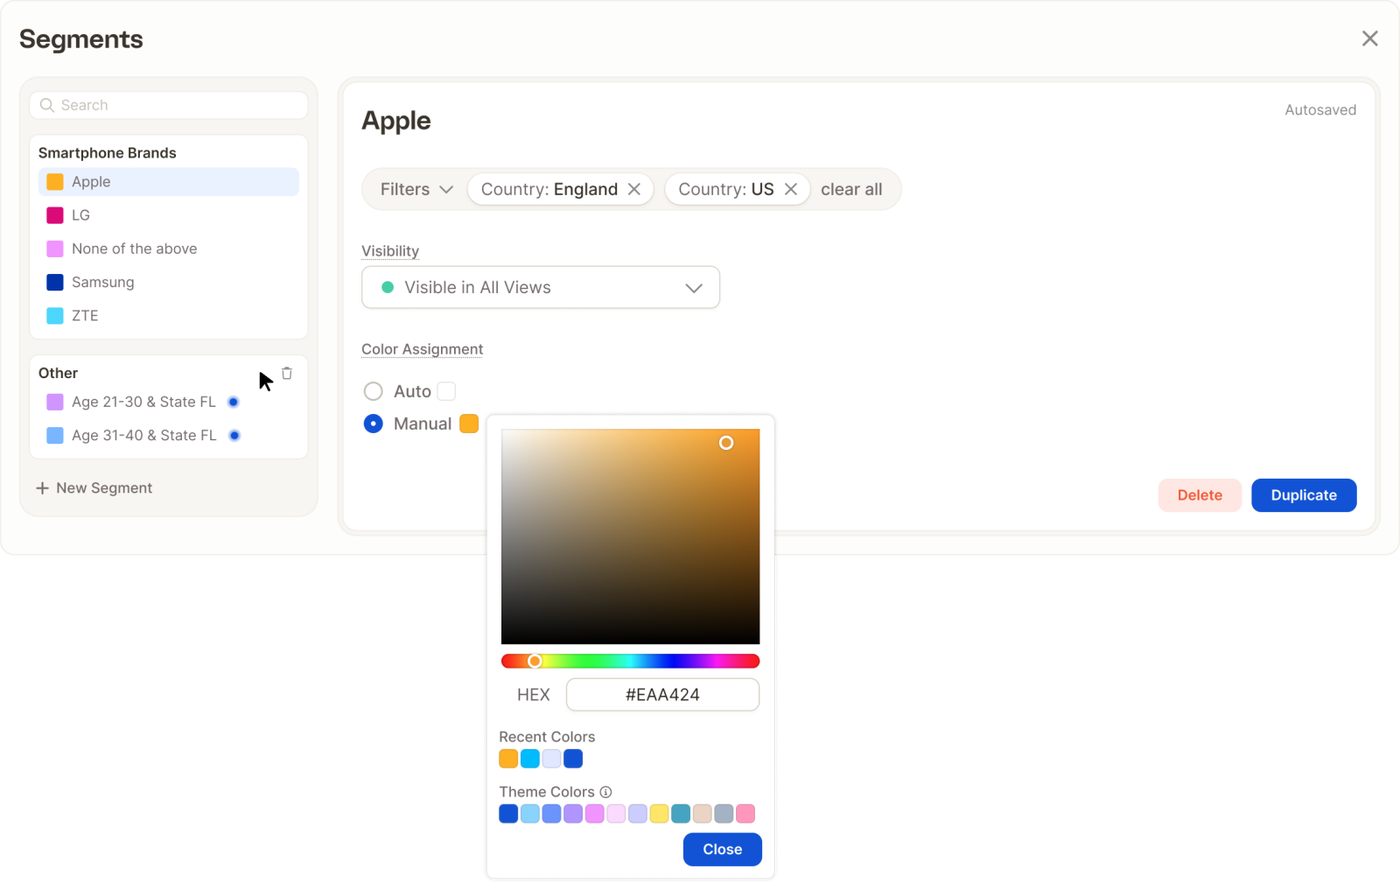
We've completely reworked how you create and manage segments in Caplena — making it faster, more flexible, and a lot more powerful.
Create Segments Your Way
The new Segment Editor gives you two ways to get started: manually or via AI prompt.
If you know exactly what you're looking for, the Manual path lets you build segments by combining filters — topics, categories, sentiment, rating, date range, and more. You get precise control over exactly which responses land in each segment.
Prefer to move faster? Use the new Create Through Prompt option: just describe what you're looking for in plain language, and Caplena will generate the segment for you. Great for exploring your data or quickly setting up common groupings without having to configure each filter by hand.
Create Multiple Segments at Once
One of the most requested improvements: you can now create multiple segments in a single flow, rather than going back and forth through the editor one by one. Select the values you want to work with and create segments from them in bulk — a big time-saver when you're setting up a new project or reorganizing an existing one.
Full Control Over Segment Appearance & Visibility
Once a segment exists, editing it is straightforward. You can update the name, adjust the filters, and pick a custom color from a full color picker (in manual- or in auto-assign mode) — so your segments are easy to tell apart at a glance in charts and tables.
You can also control visibility: choose which segments are shown or hidden in your views, keeping things clean when you're working with a large number of groups.
The updated Segment Editor is available now across all projects via Edit Master. Give it a try and let us know what you think.
We've optimized rendering for table-based insight elements — especially when displaying a large number of topics. If you've been using the "All topics" selection in your reports, you should notice significantly faster load times and smoother interactions.
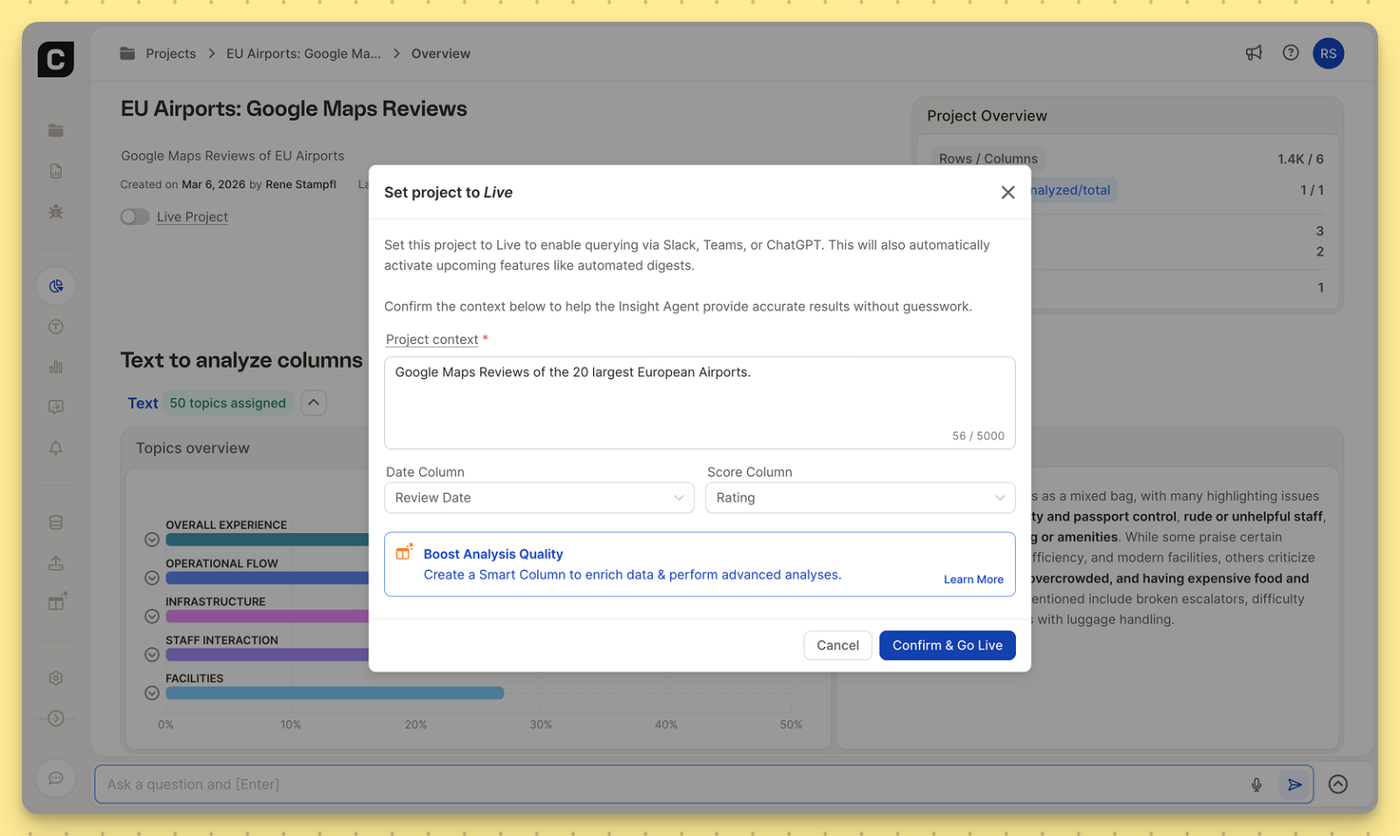
To get the most accurate answers from Caplena’s Insight Agent—especially when querying your data via Slack, Microsoft Teams, or ChatGPT, the AI needs to understand the blueprint of your project.
We’ve rolled out a few structural updates to reduce AI guesswork and make the Insight Agent even more powerful:
10x More Project Context: We’ve increased the character limit for your Project Context from 500 to 5,000 characters. You now have the space to thoroughly brief the AI on the specific nuances, background, and goals of your dataset.
Default Date & Score Columns: You can now explicitly define which columns represent your primary timeline (e.g., Review Date) and primary metric (e.g., Rating). By setting these defaults once, the AI immediately knows how to accurately track trends and weigh sentiment without needing extra prompting.
Where to find it: You can update these anytime in the Data View, or simply confirm them when setting your project to Live to connect with everyday tools like Slack, Microsoft Teams, or ChatGPT.
We’ve separated the global Report Master from your custom Views for a cleaner, more intuitive workflow. Plus, sharing just got a major upgrade. Let's dive in:
🧱 Edit Report Master: Think of it as your global foundation: Manage insight elements & sections per drag & drop, create segments and apply filters. The settings will automatically cascade down to all of your Views.
🔎 Configure Views: Select segments, apply filters, and lock them exactly as you are used to. Keep the Views sidebar perfectly organized by easily dragging & dropping your Views into any order.
🚀 Share: You can now instantly share a single View, a custom selection of Views, or the entire Report.
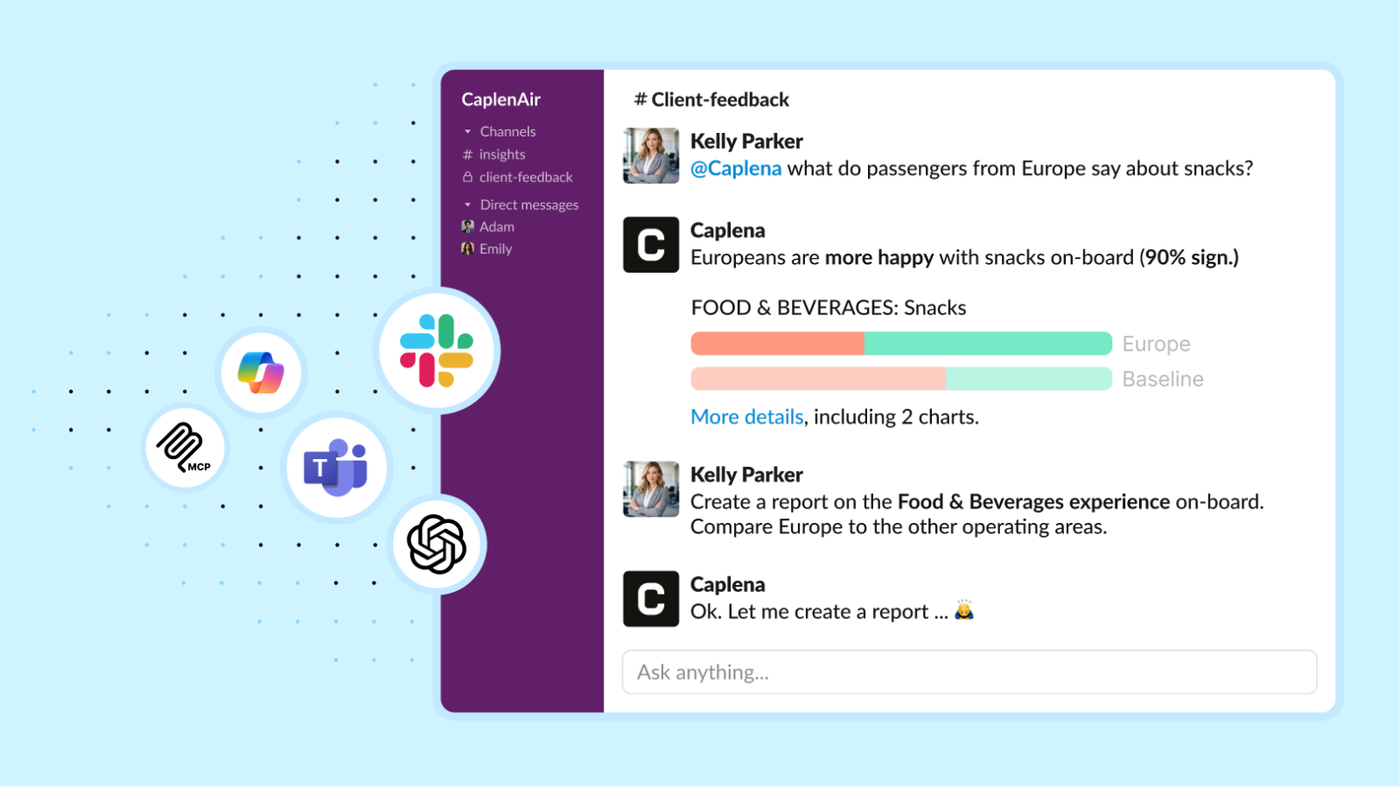
Powerful for Experts, Effortless for Everyone — now where work happens. Insight Agent is now available in Slack, Microsoft Teams, Copilot, and ChatGPT (MCP), so anyone can ask questions and get reliable insights without leaving their daily tools.
This is a big step toward democratizing insights across your organization: experts move faster with on-demand analysis, while non-research teams self-serve clear, actionable answers — no dashboards, training, or back-and-forth required. Less chasing data. More turning feedback into decisions. 💪
How it works
Create a shared channel (e.g., #customer-feedback-insights)
Ask questions by tagging the agent with @Caplena in 1:1 messages or public channels
Here is an example question: @Caplena What topics had the biggest impact on the NPS change in the last 4 weeks?
Advantages
Help teams discover what the bot can do (and copy great prompts)
Learn from each other’s use cases over time
Discuss insights together — and jump in if you disagree
Keep decisions and learnings accessible for everyone
👉 Set up the integration in your Integrations Settings and get started.
Insights are most powerful when they show up at the right moment — in the tools you already use. With these new integrations, Caplena fits seamlessly into your daily workflows, helping teams move from feedback to action with less friction.
Simply select the projects you want to connect and query your insights directly from your go-to tool.
💬 Slack & Microsoft Teams
Share project updates, alerts, and insight summaries in the channels your organization already relies on — keeping everyone aligned without switching tools.
🤖 MCP Integration
Connect Caplena to MCP-enabled AI workflows to build custom automations and intelligent insight pipelines — tailored exactly to how your teams work.
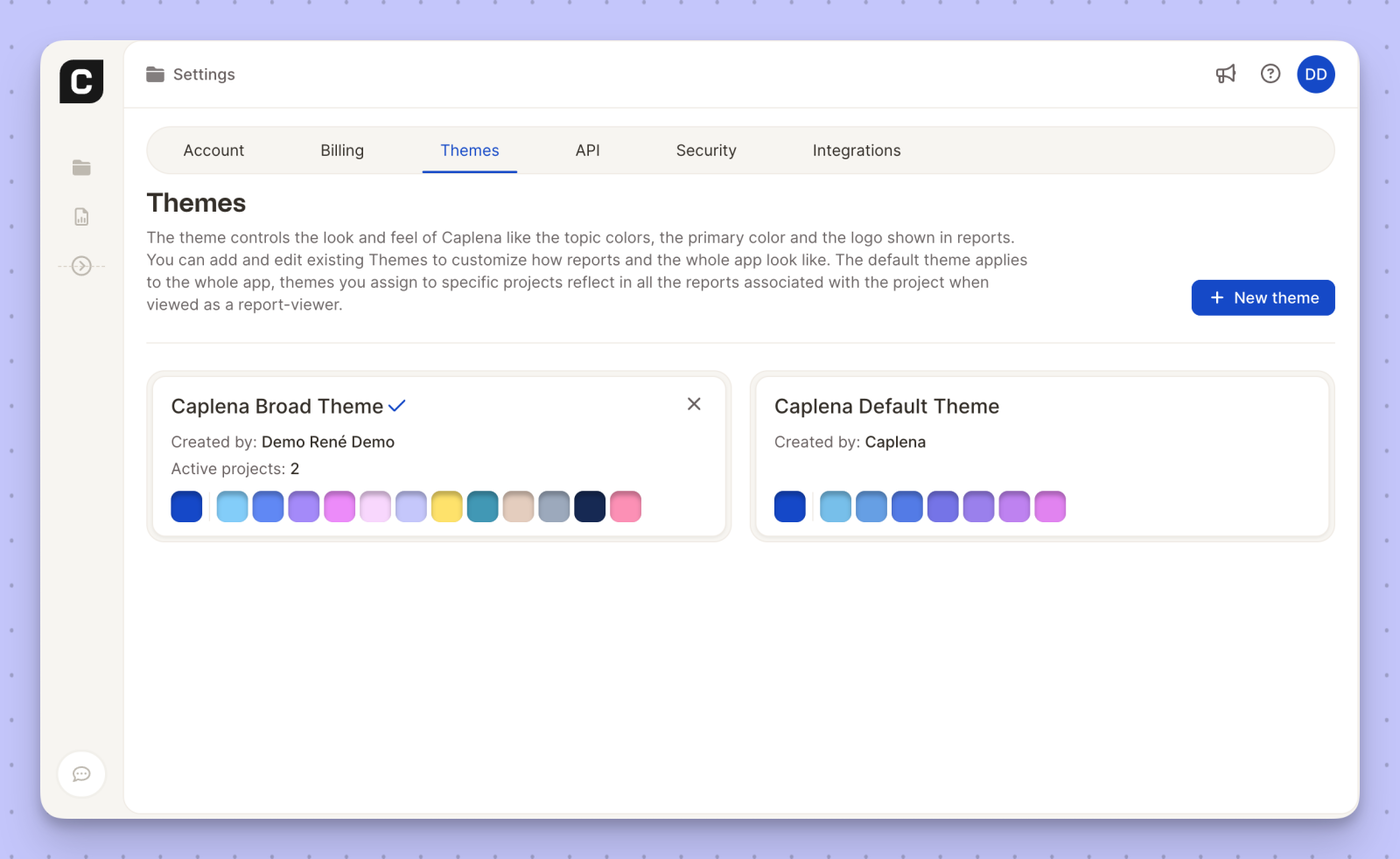
We’ve added a brand-new Caplena Broad Color Theme to give your reports more visual flexibility and a richer color palette.
The new theme expands the range of topic and chart colors, making it easier to:
Clearly distinguish categories and segments
Create more expressive, client-ready reports
Maintain visual clarity even in complex analyses
You can manage and assign the Caplena Broad Color Theme from Settings → Themes, just like any other theme. Once applied to a project, it will automatically reflect across all associated reports for report viewers.
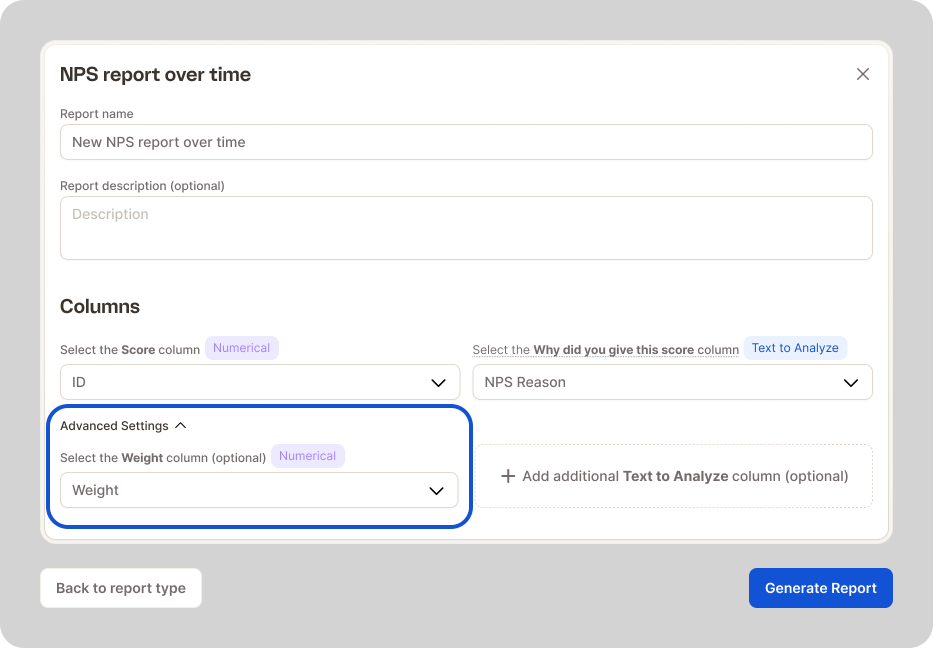
No more worrying about skewed results or unbalanced samples — you can now apply weighting variables directly in your reports.
Here’s what’s new:
⚖️ Weighted results — Upload a numeric weighting column and let Caplena apply the variables automatically across NPS scores, percentages, and other key metrics.
📊 More accurate reporting — Ensure results remain representative, even when sample compositions shift between waves.
💡 Consistent KPIs — Keep your data aligned with the way you already report internally.
Whether you’re tracking customer sentiment over time or comparing markets, weighting variables help you get truer insights.
>> Simply upload your weighting column and select it when creating your report.
We know every audience needs a slightly different story. That’s why we built Views — a smarter way to organize, personalize, and share your reports.
WithViews, you can now:
Create multiple Views of the same report — one for each stakeholder, region, or product team.
Apply unique filters and segments without affecting the original report.
Lock filters or hide segments to keep key perspectives fixed while still allowing others to explore further.
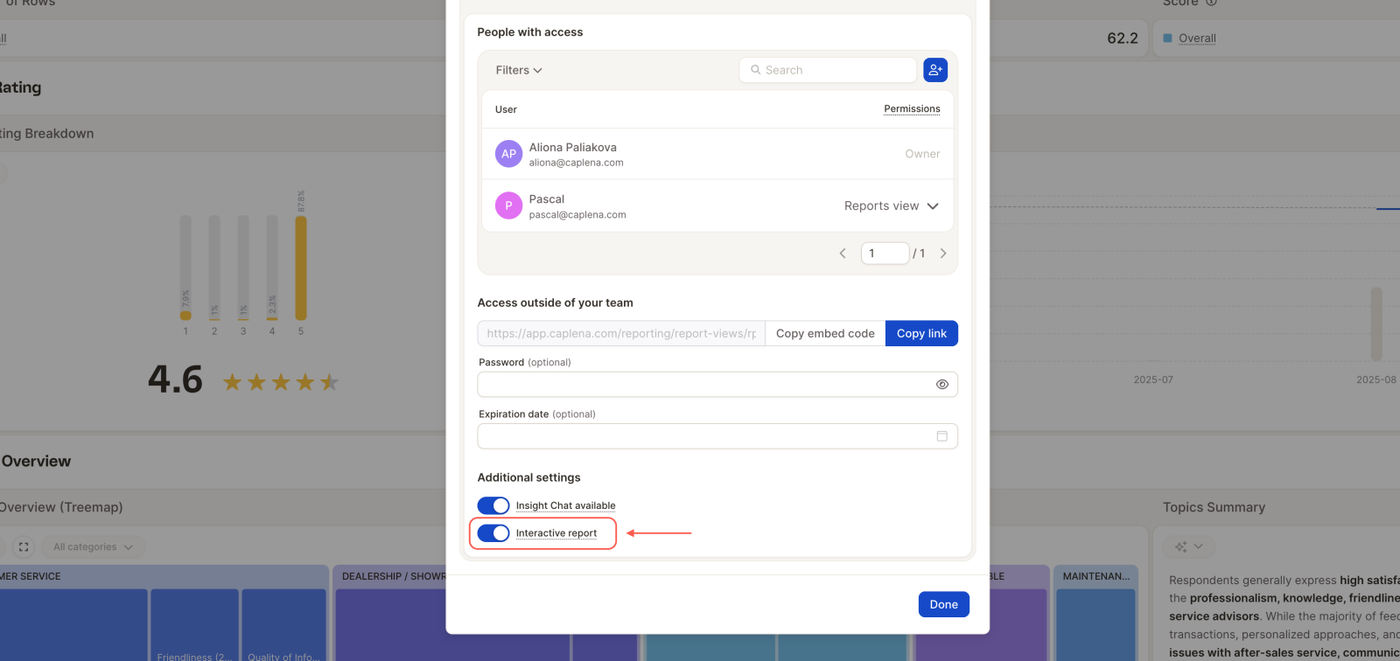
Share Views securely — inside your team or externally via link, with optional password or expiration date.
Turn Insight Chat on or off, allowing viewers to explore your report more interactively, or keep it off for a focused, read-only experience.
No more endless versions or one-size-fits-all dashboards. Just clear, focused insights — customized for every audience. 🚀 Available now under your report’s “Views” panel.