You can now connect Caplena directly to Google Cloud Storage.
This new integration lets you import feedback and text data straight from your Google Cloud Storage buckets into Caplena. Whether you’re working with continuous data exports, archived feedback, or structured text files, Caplena fits seamlessly into your existing cloud setup
👉 Set up the integration in your integrations settings and get started.
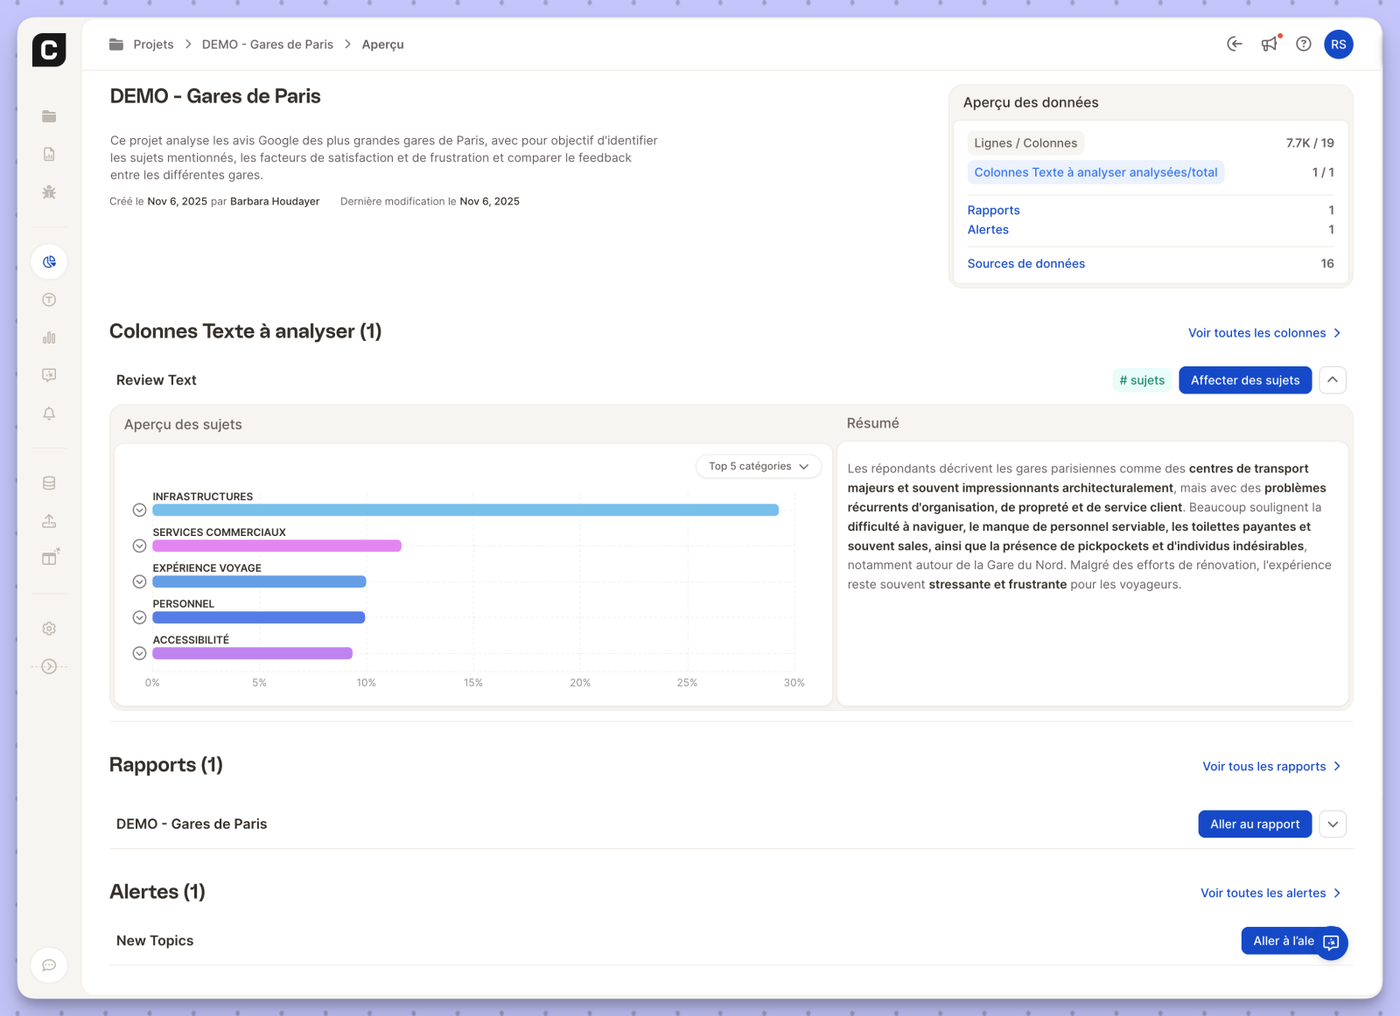
You can now use Caplena’s interface in French, making it easier for French-speaking teams to explore feedback, uncover insights, and collaborate across regions. From navigating projects to working with reports and insight elements, everything feels more natural in your preferred language. 🇫🇷 🥐
This update is part of our ongoing commitment to make insights accessible to global teams — wherever they work and whichever language they think in.
👉 Switch the interface language in your account settings and start exploring Caplena en français today.
Insights-Chat just got a serious upgrade. It no longer just answers questions — it now walks you through your data like a true analyst would.
Here’s what’s new:
1️⃣ Context first – Every answer starts with a solid basis: context, underlying data points, and why they matter.
2️⃣ Quantitative insights – See the numbers, metrics, and trends behind the story.
3️⃣ Qualitative insights – Understand what customers are actually saying, surfaced down to the verbatim level.
4️⃣ Visual support – Charts and graphics illustrate the findings, making complex points easy to digest.
5️⃣ Next-step guidance – Insights-Chat now even suggests what you should analyze next, helping you dig deeper without losing momentum.
🚀 The result: a conversation that feels less like querying a tool and more like collaborating with a data analyst.
Tired of jumping between views to narrow down your data? We’ve revamped and unified filters across the entire Caplena platform—so filtering is now smoother, smarter, and more consistent than ever:
🧩 Filter by Topics & Categories
Pinpoint themes or topic sets right within your reports—no need to switch between Topics and Reports view.
🔢 New Smart Numbers Filter
Need to look at scores, ratings, or counts? Our smart numeric filter lets you quickly slice data by exact values or ranges.
📅 Two Great Date Range Filters
Static Range (e.g. Jan 1–Mar 31, 2025)
Rolling Range (e.g. Last 7 days, Last quarter) Perfect for trend analysis without manual date entry.
Made a mistake with a file upload? Or want to track what came from which integration? We've got you covered. You can now filter by upload name and type!
Quickly isolate data from a specific file or integration
Effortlessly “undo” or clean up an accidental upload
Great for managing multiple data sources with confidence
You can now invite unlimited reporting-only users to your Caplena workspace — ideal for sharing insights with larger teams, departments, or external stakeholders.
Whether they're inside or outside your organization, anyone can now access your reports without editing rights — helping you scale insight sharing without limits. 🚀
No limits on reporting-only viewers
Great for broader access without editing rights
Updated Team page to manage reporting-only users with ease
Tired of scrolling through endless dropdown menus? Now you can mark your favorite columns and have them appear right at the top for faster selection. No matter if within reports or an InsightChat conversation!
Simply head to the Data Table, pick your most-used columns, and ⭐ favorite them for effortless access.
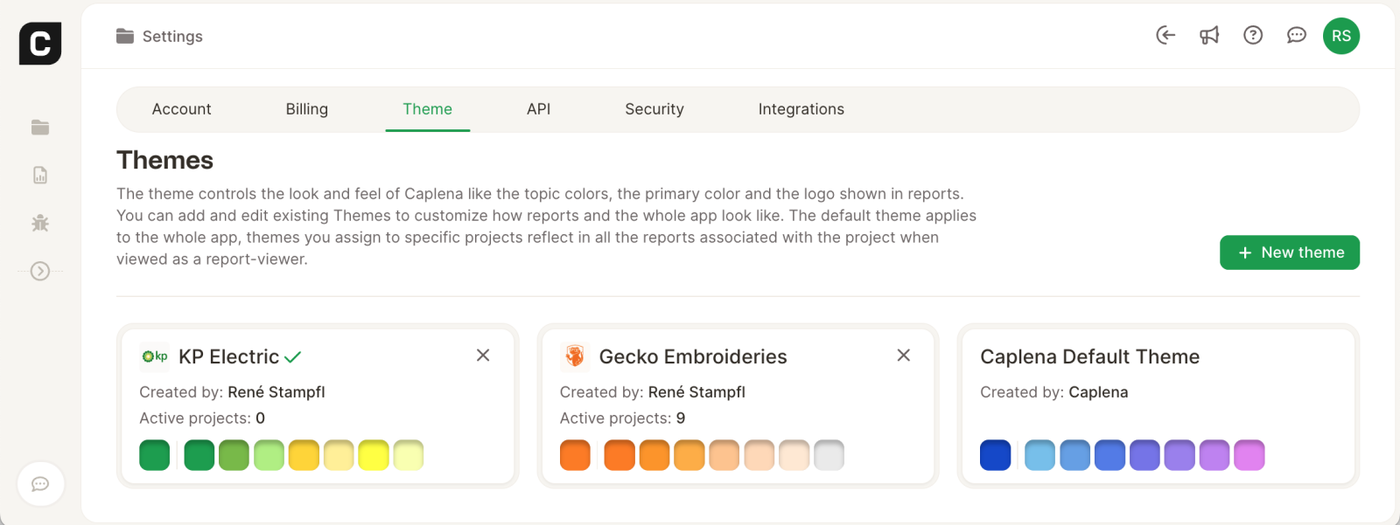
Your data, your style! Caplena now lets you customize color themes within the app, giving you more control over how your insights are visually presented.
🟥 Personalized Look & Feel – Adjust colors to match your brand or preferences. 🟦 Enhanced Readability – Improve contrast and clarity for better data visualization. 🟧 Consistent Branding – Align report visuals with your company’s identity.
We're excited to unveil Insight Chat, our new conversational AI assistant designed to revolutionize how you explore and analyze your feedback projects. Here's what Insight-Chat brings to the table:
What’s New?
Conversational Exploration – Engage in natural language conversations. Ask specific questions or let the AI show you relevant insights.
Faster, Decision-Making – No more manual digging—just ask, and get the answers you need.
Instant Visual Insights –Receive immediate graphical representations of your data, including trend analyses and sentiment overviews, enabling quick comprehension and decision-making.
👉 Dive in and let your data conversations begin either through the navigation bar or a report! Read more.