Sep 16, 2025
Valuable insights start with rich data. That’s why we built a powerful data enhancement feature — think Excel at scale, supercharged by LLMs. With Smart Columns, you can now:
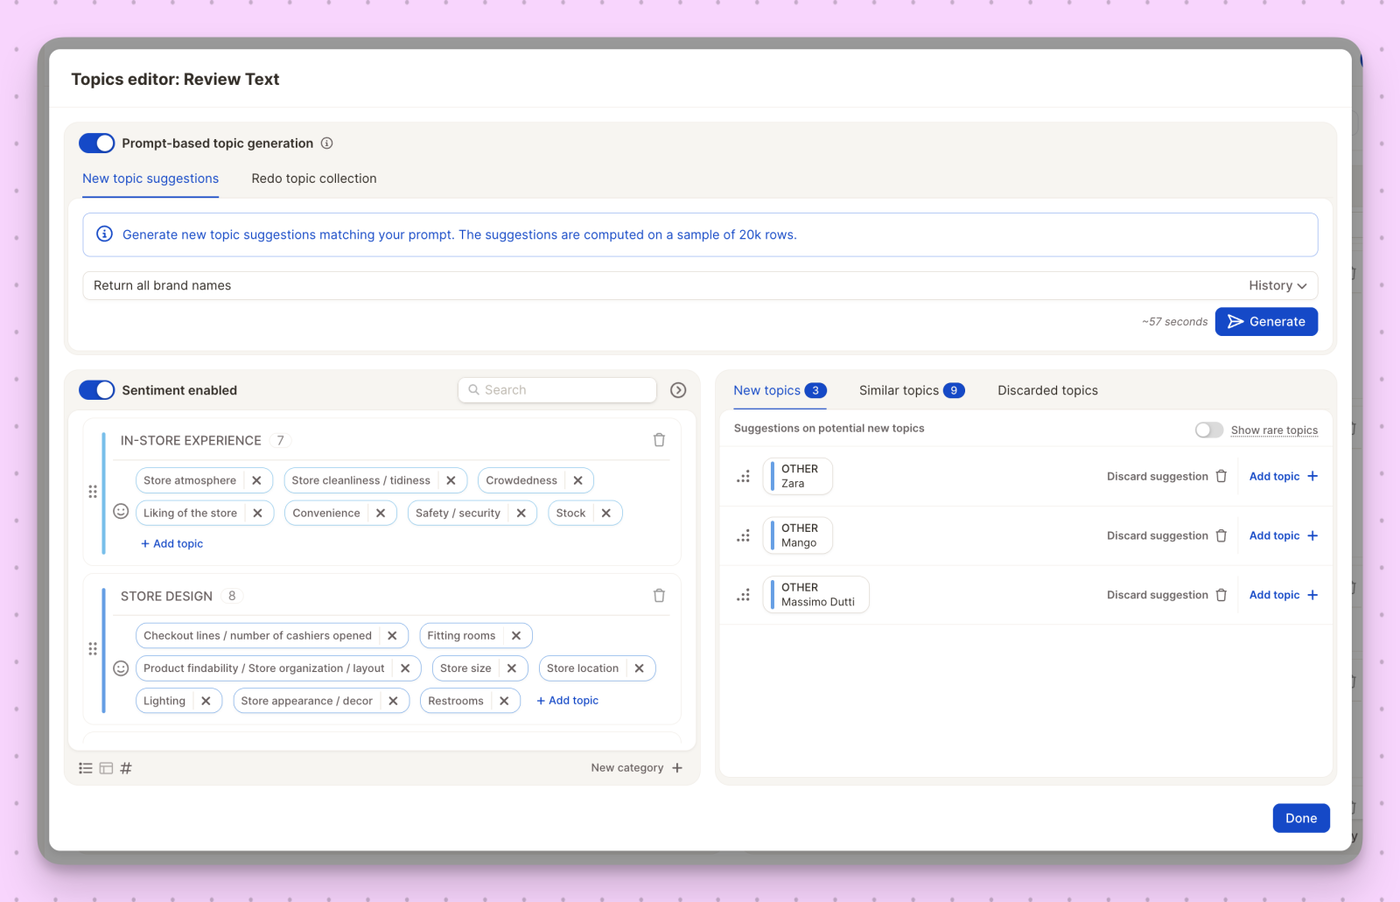
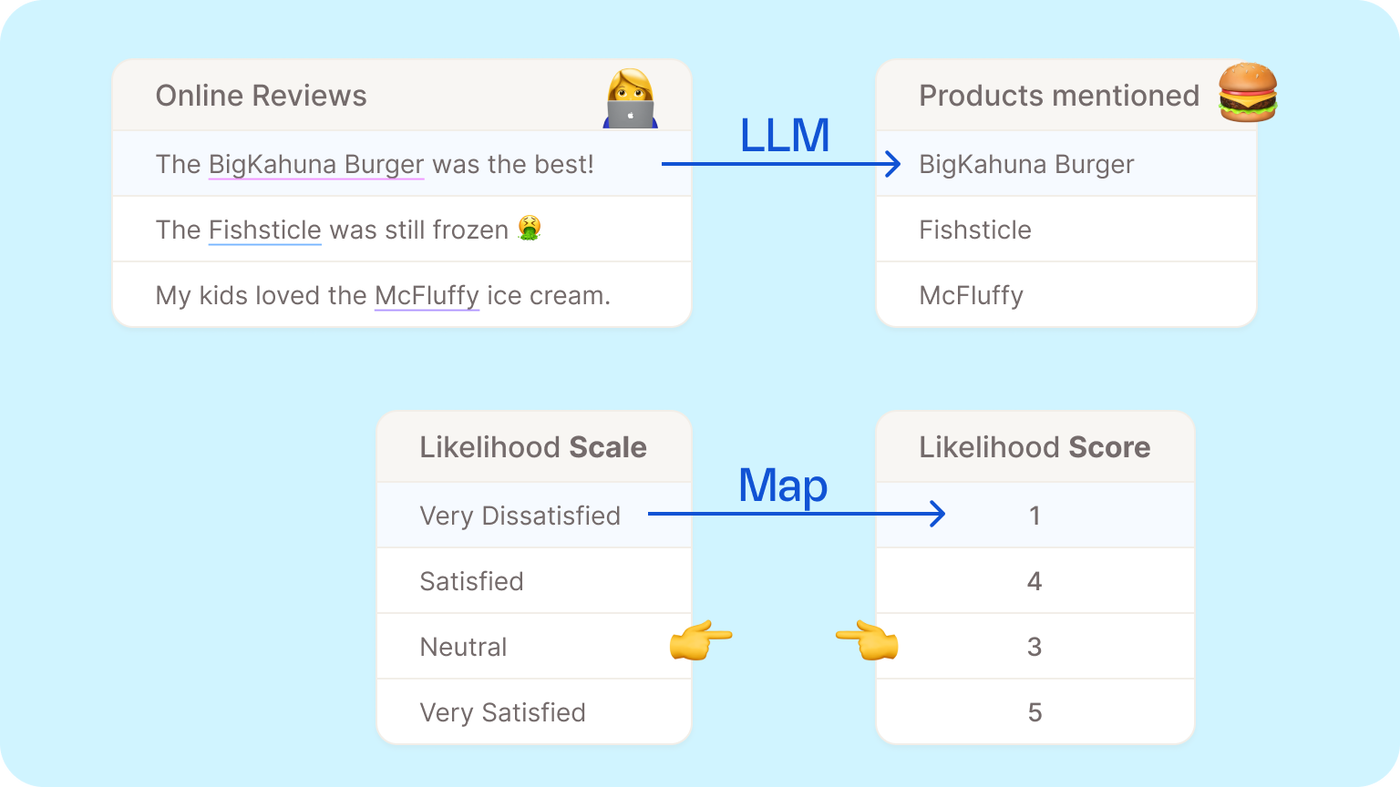
🤖 Use LLMs to apply a prompt to each row (e.g.: Extract structured insights like product names or brands) from free-text feedback, fix spelling mistakes)
✨ Map values from one column to another (e.g.: Transform scales to scores)
🧮 Run formulas across existing columns (e.g.: Merge likes & dislikes)
Your new columns update automatically whenever source data changes — no manual edits required.
Whether you're standardizing formats or using AI to tag content, Smart Columns do the heavy lifting.
🔍 Try it out via the “Smart Columns” section in your side bar navigation.