Mar 02, 2026
We’ve separated the global Report Master from your custom Views for a cleaner, more intuitive workflow. Plus, sharing just got a major upgrade. Let's dive in:
- 🧱 Edit Report Master: Think of it as your global foundation: Manage insight elements & sections per drag & drop, create segments and apply filters. The settings will automatically cascade down to all of your Views.
- 🔎 Configure Views: Select segments, apply filters, and lock them exactly as you are used to. Keep the Views sidebar perfectly organized by easily dragging & dropping your Views into any order.
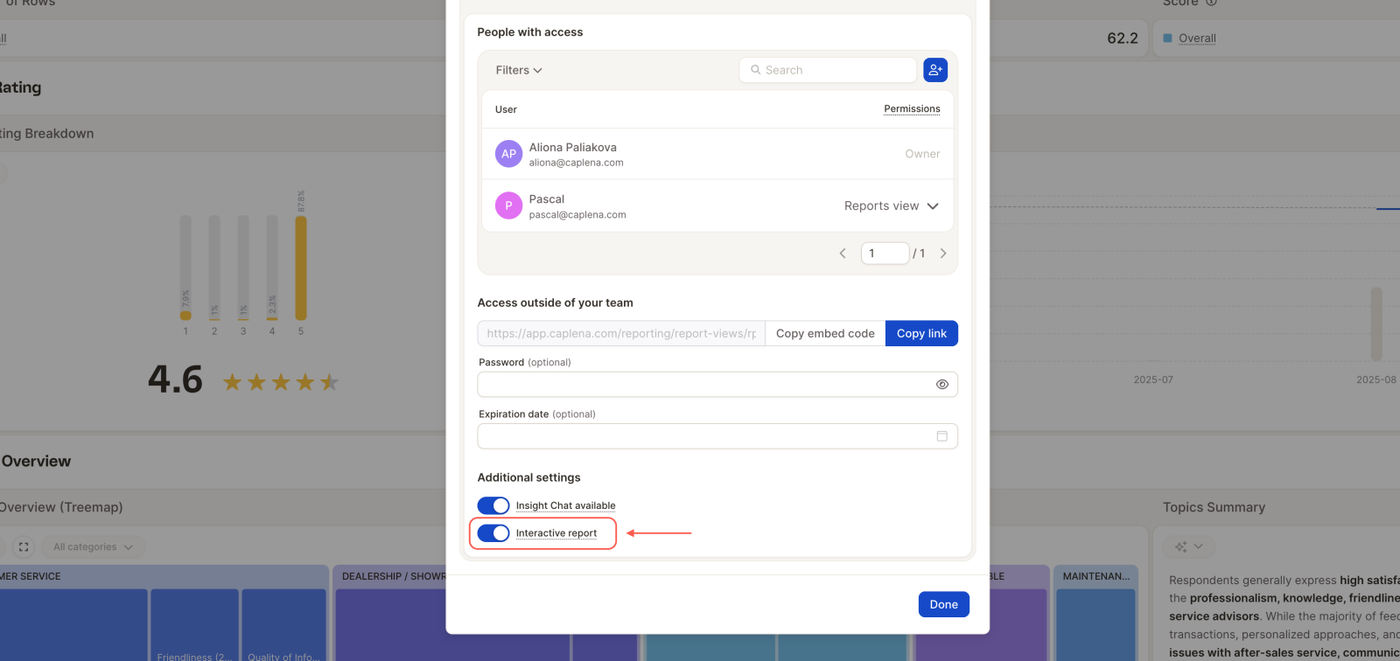
- 🚀 Share: You can now instantly share a single View, a custom selection of Views, or the entire Report.